Changelog
Follow along with what's new in TrekWeather


Lightning Potential: Pick the Day, Plan the Turnaround
BETA V3Major ReleaseLightning Potential V3 makes it easier to answer the questions that matter before a mountain day: Which day looks worth considering, and when should I be off exposed terrain? The redesigned week view makes the days easier to compare, while the rebuilt hourly view shows when the storm signal starts building so you can plan a conservative turnaround before leaving the trailhead.
Behind the scenes, V3 cross-checks TrekWeather’s storm-ingredient score with NOAA’s National Blend of Models. That second perspective helps surface setups the ingredients alone can miss and keeps High and Extreme focused on hours with stronger support.
Lightning Potential is still in beta and is planning guidance, not a prediction of lightning at your exact location. Always check official forecasts, radar, alerts, and conditions around you.
- Compare the week at a glance before committing to a day
- See the full day hour by hour, including when the storm signal starts building
- Focus on the next 48 hours while keeping the extended outlook clearly separated
- A second NOAA signal now cross-checks the underlying storm ingredients
Google WeatherNext 2 Joins Forecast Uncertainty
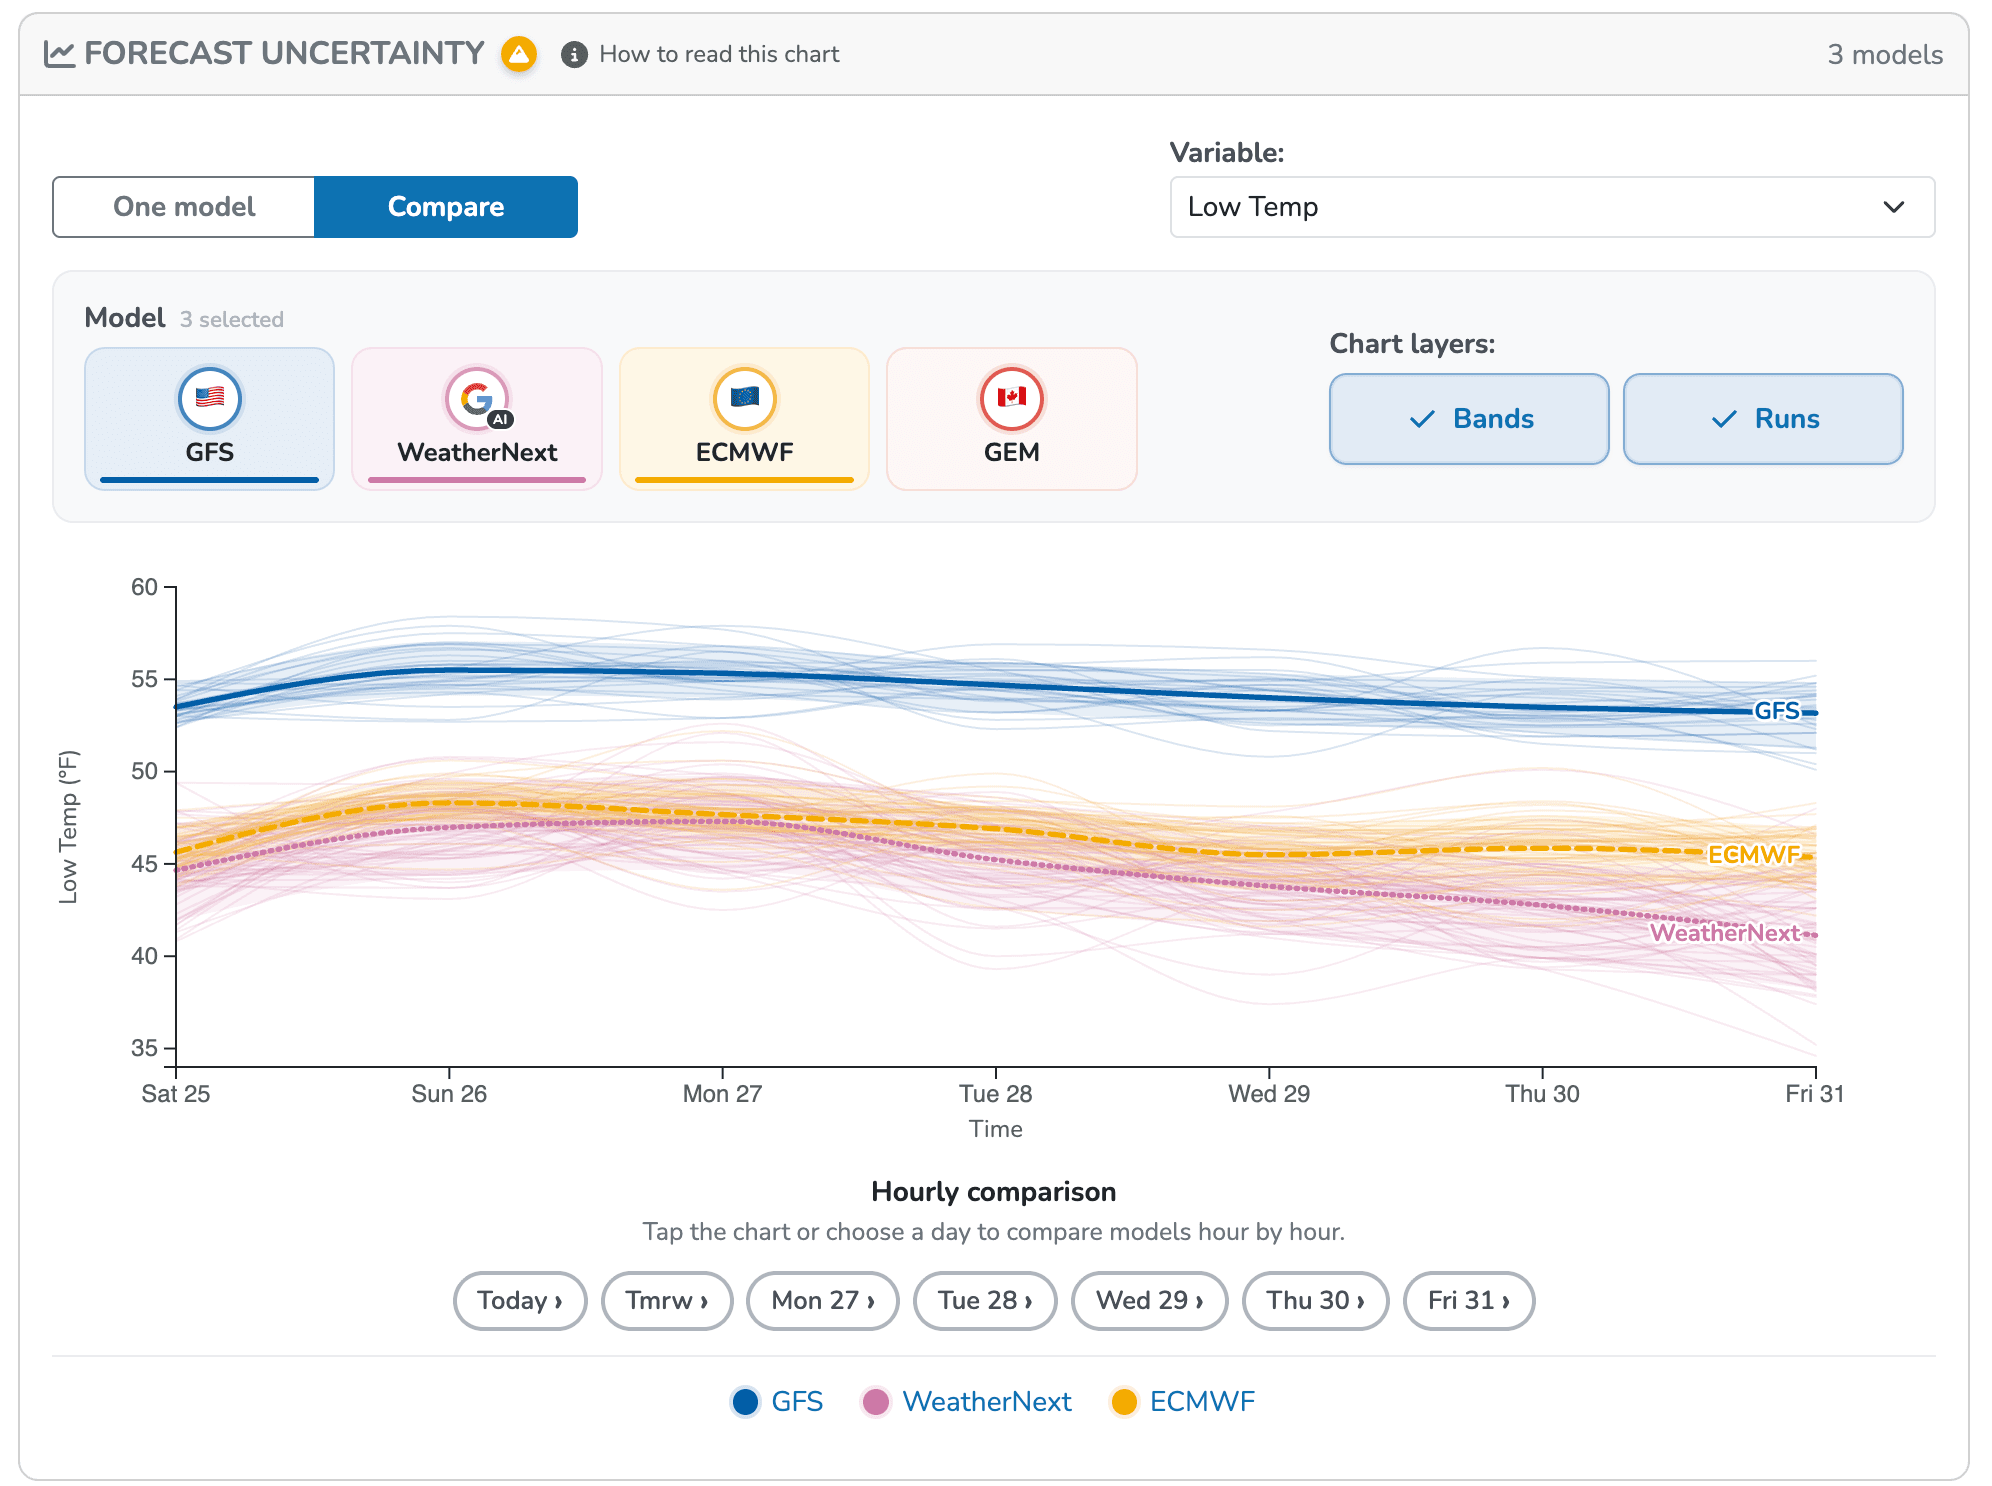
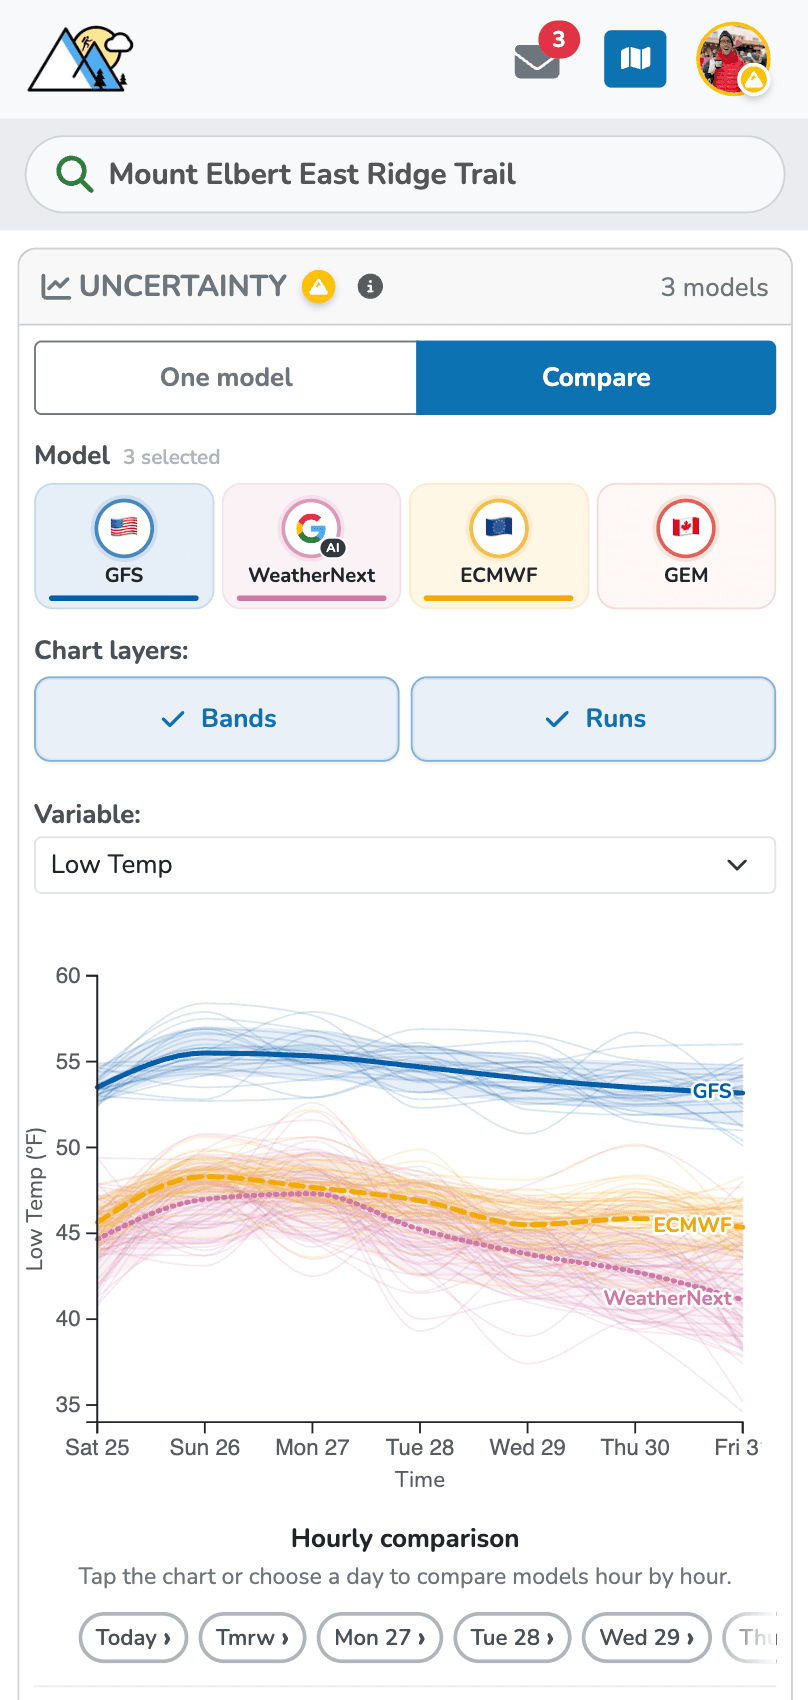
Minor UpdateGoogle's WeatherNext 2 AI model is now available in Forecast Uncertainty. Use it on its own or compare it directly with GFS, ECMWF, and GEM to see where AI and traditional forecast models agree or diverge.
So what is it? WeatherNext 2 is Google DeepMind and Google Research's global, medium-range AI ensemble model. It generates 64 plausible weather scenarios out to 15 days, helping show not just one prediction, but the range of ways the atmosphere could evolve.

Your Locations: Everything You Saved, In One Place
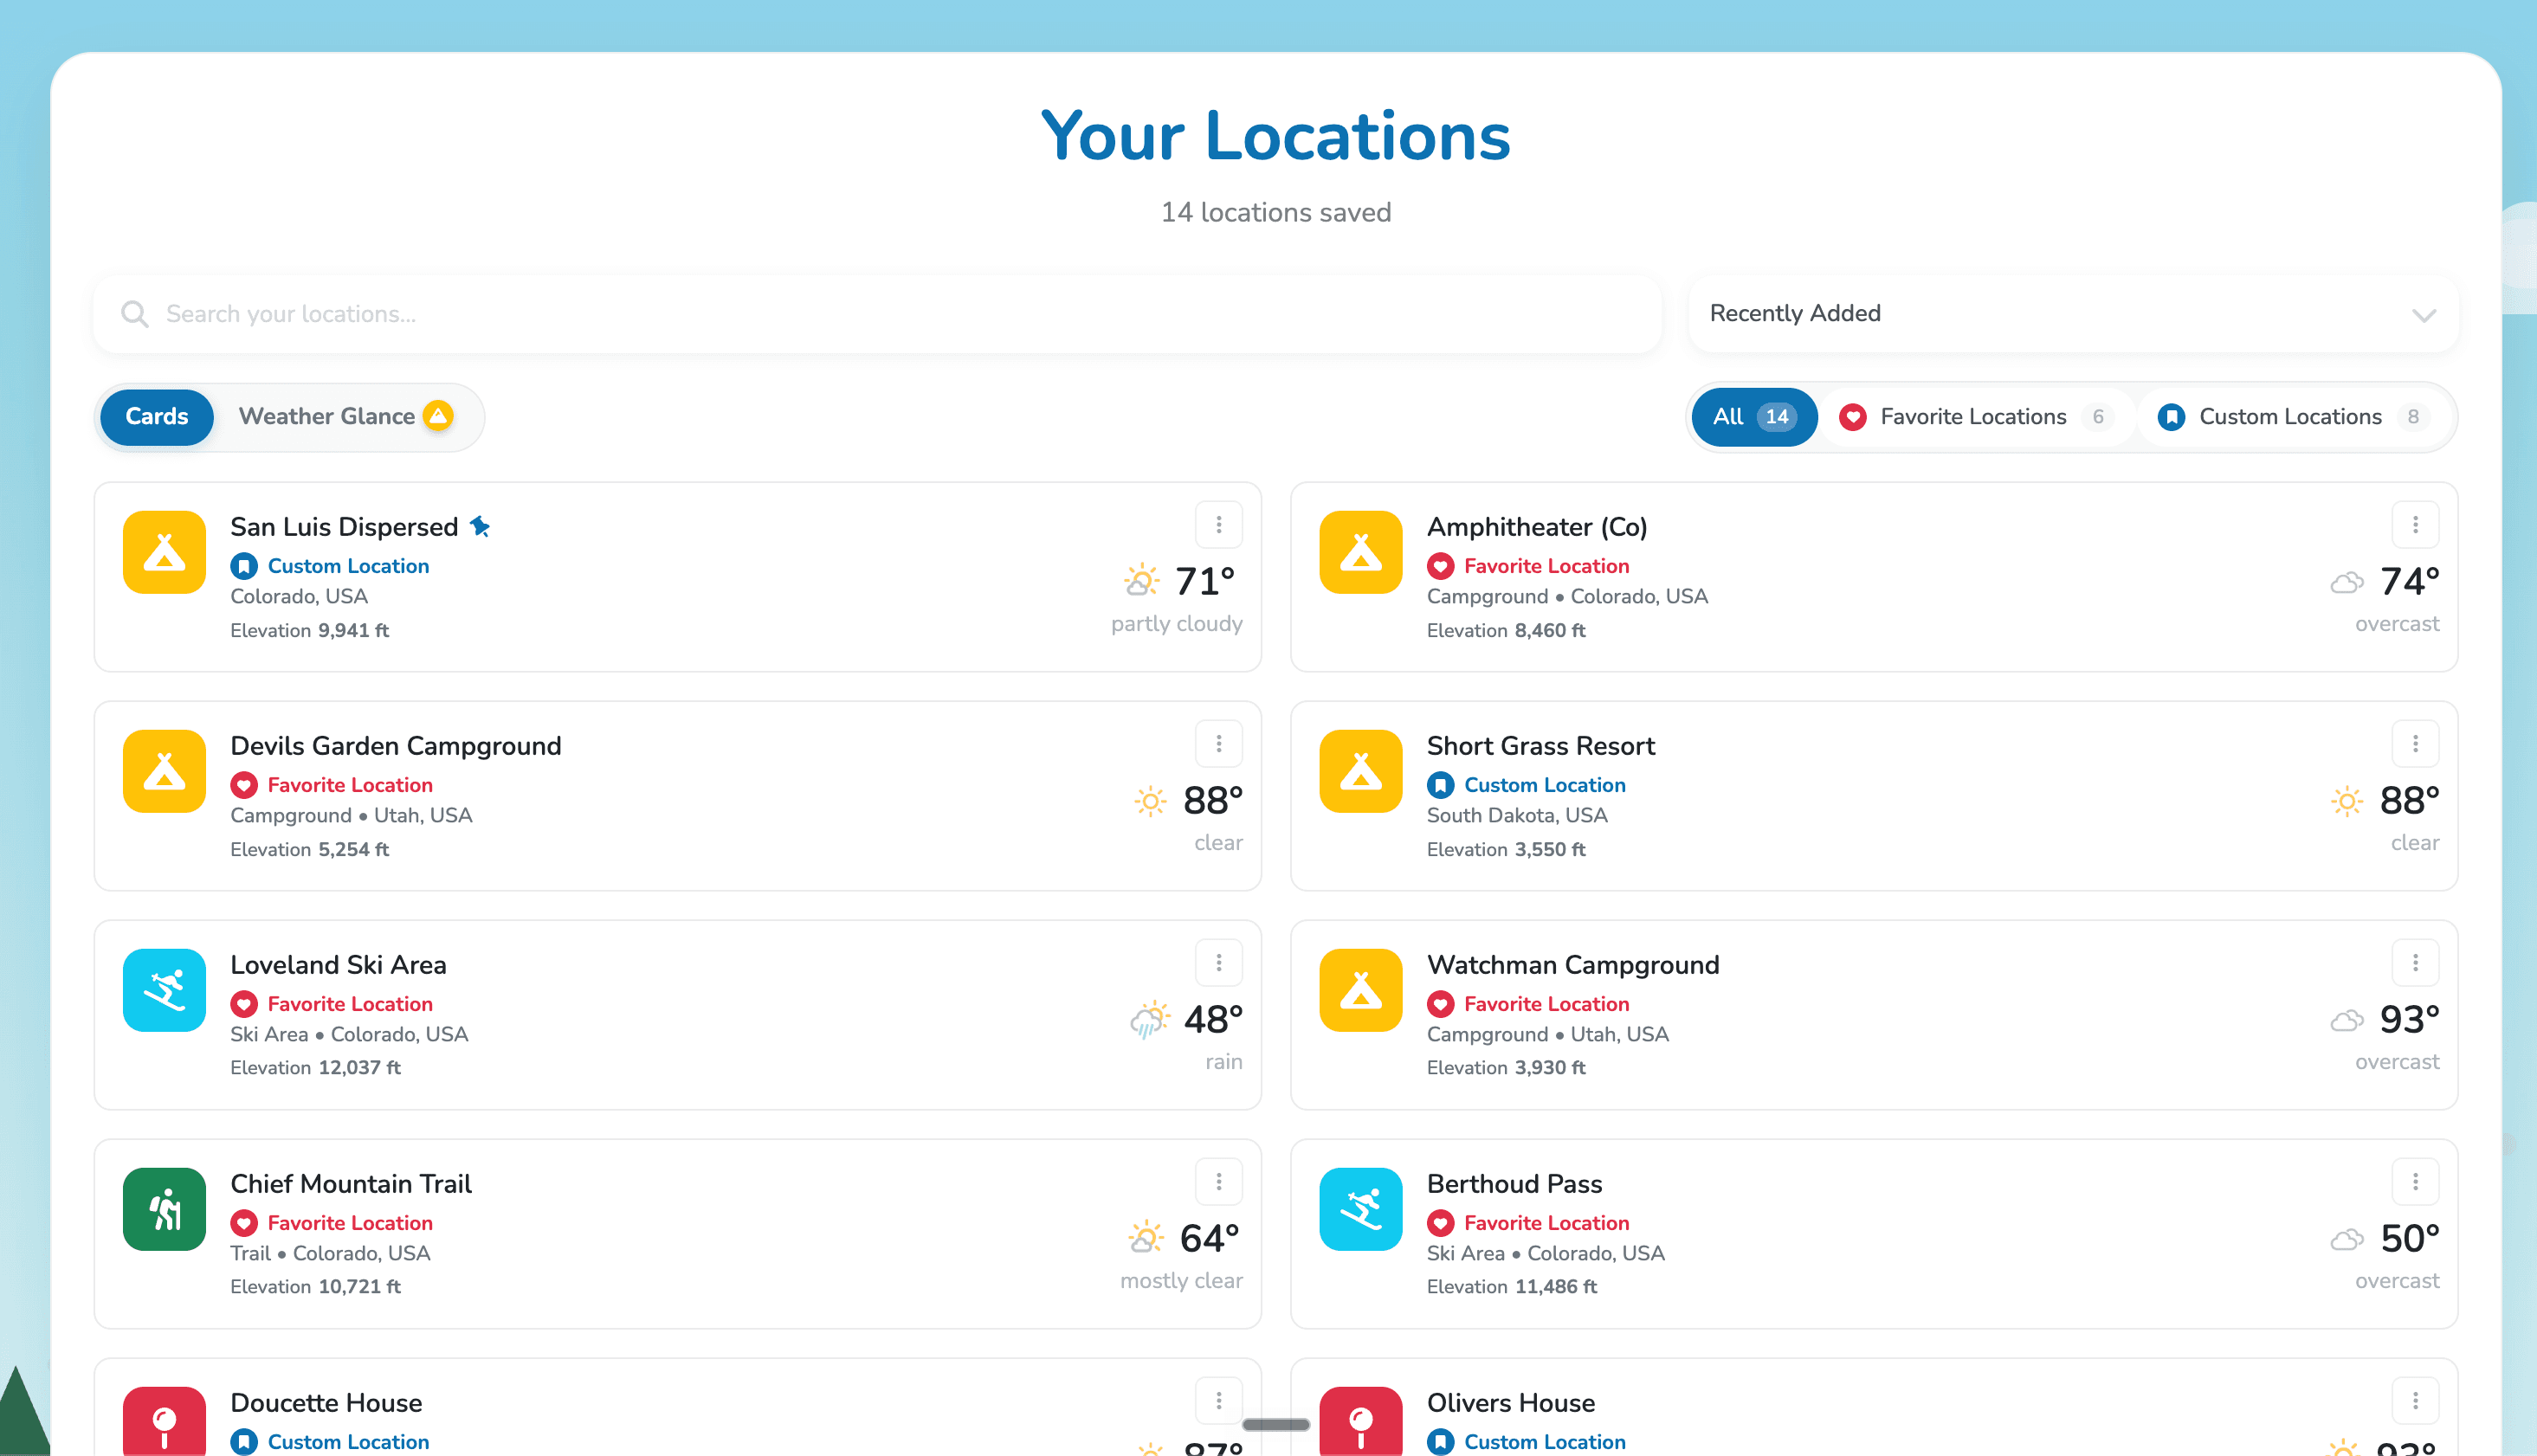
Major ReleaseYour favorites lived on the Favorites page, but custom locations had no page of their own. The workaround was ugly: every custom location also had to be a favorite just to be visible anywhere. Two lists, one hack, and no weather on either. It was confusing and hard to reckon with.
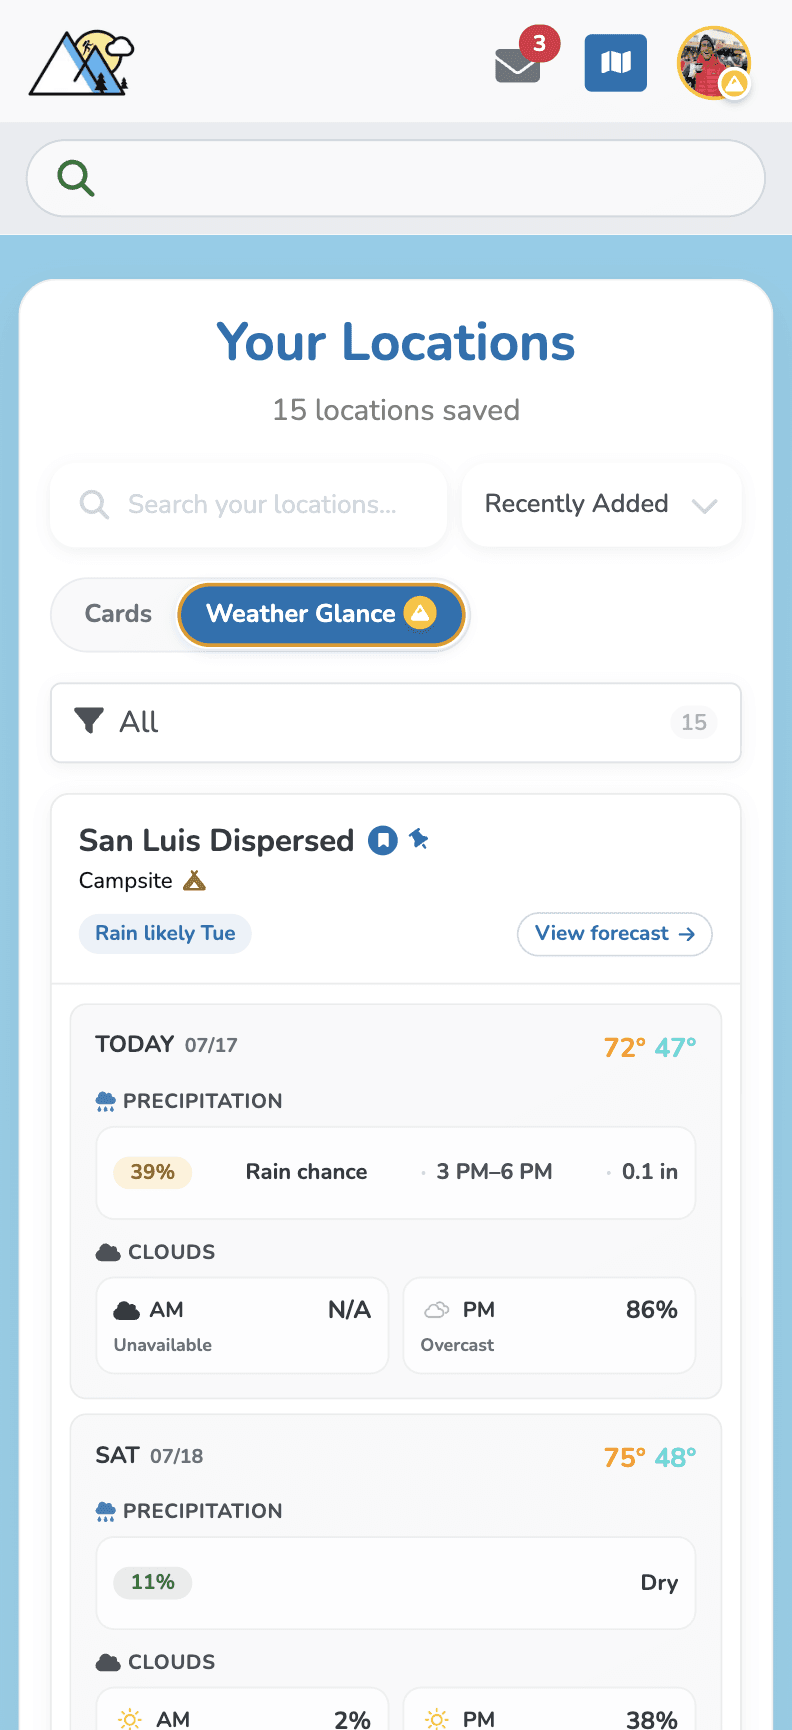
So I redid the whole thing. Favorites and custom locations now live together on one page, every card shows current conditions plus a three-day outlook, and you can pin the places you check most to the top. Your recent searches follow your account too, so the spot you looked up on your phone is waiting on your laptop.
- One page for favorites and custom locations, with weather on every card
- Pin your most-checked spots to the top, and edit or share a custom location right from its card
- Recent searches sync to your account across devices
- Premium: a Weather Glance view that compares rain and cloud cover across all your places for the next five days
Smoother Saved Locations
Minor UpdateI noticed that saving a location from the Explore map was more of a pain than it should have been, so I cleaned up the flow. You can now save an exact spot from its full forecast page, and when you save from the Explore map, the saved location stays right in front of you so you can view it or keep exploring without losing your place.
Open the Explore mapCompare GFS, ECMWF, and GEM
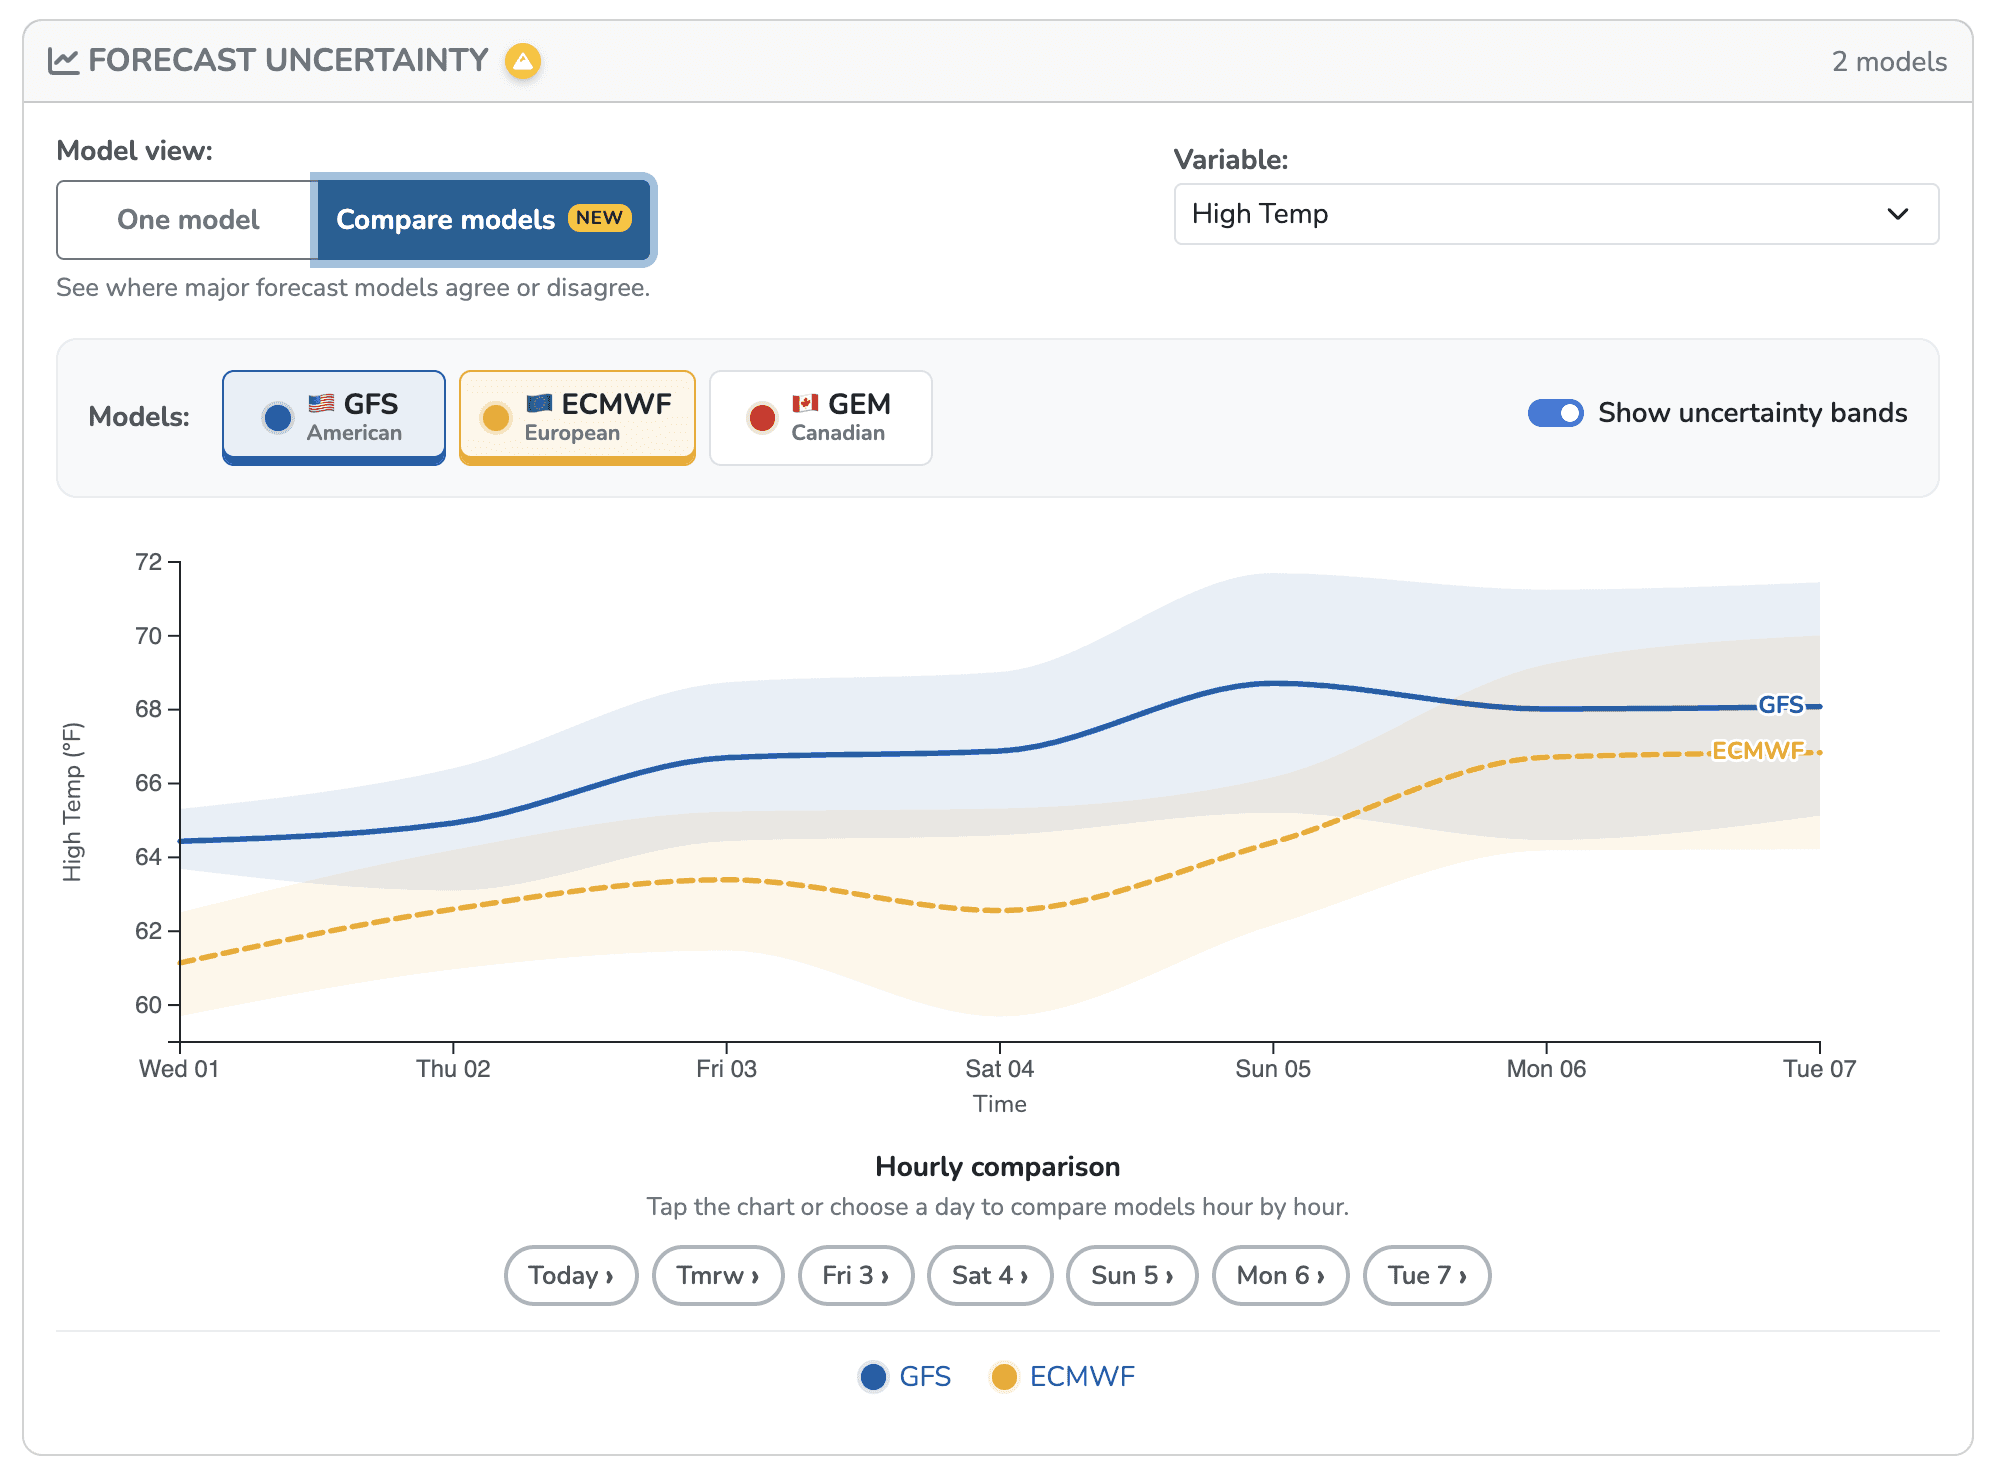
Major ReleaseI was planning a camping trip, but GFS showed rain while GEM showed much less. Flipping between them made the chart rescale, so I couldn't tell how far apart the forecasts really were.
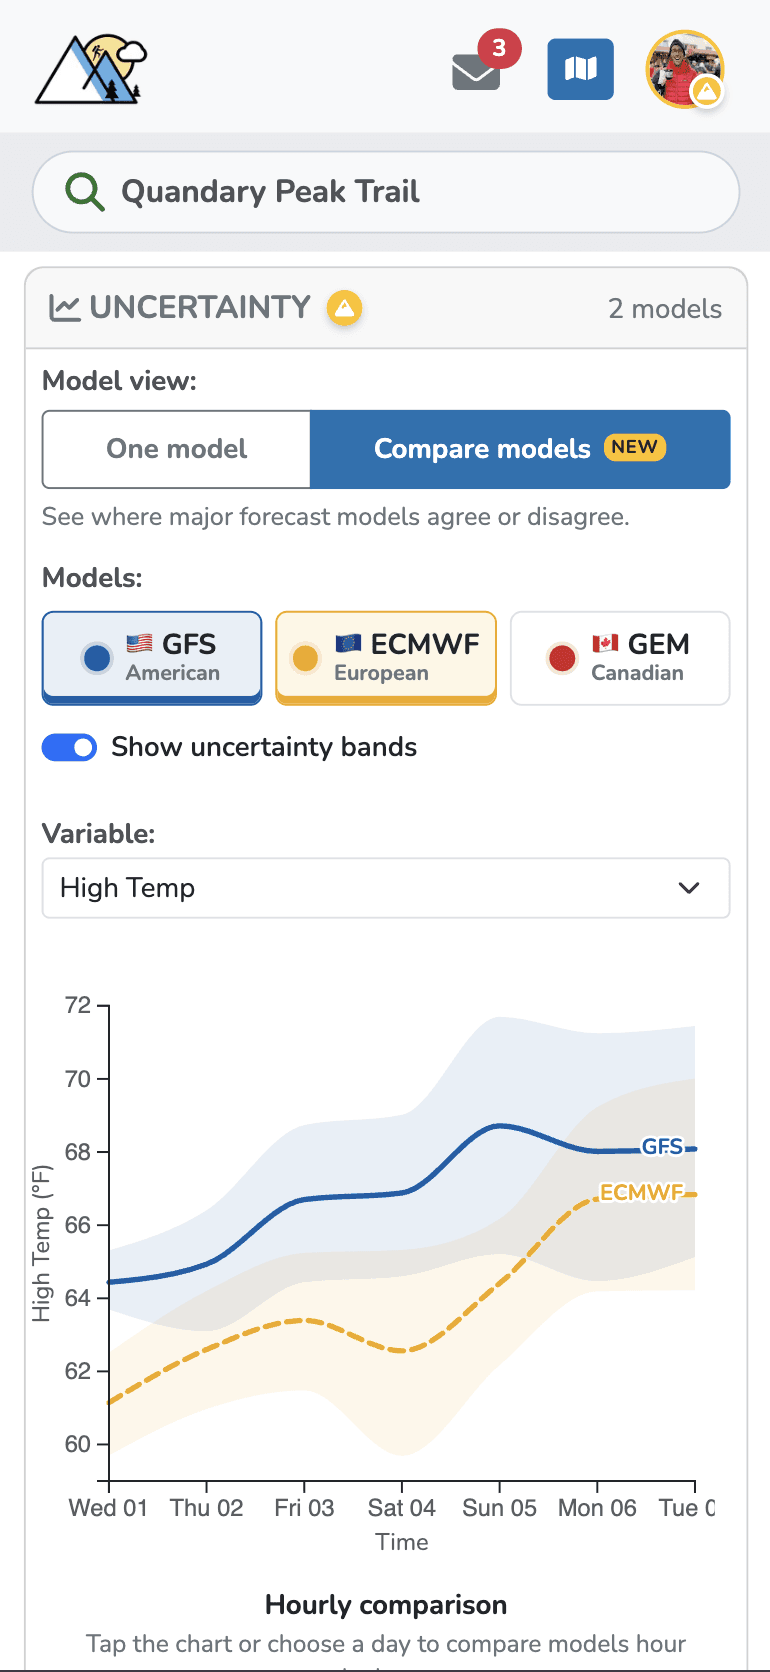
Compare mode puts GFS, ECMWF, and GEM on one shared chart. You can quickly see where the models agree, where they split, and which days need a more flexible plan. Tap any day to compare them hour by hour.
- Compare GFS, ECMWF, and GEM on one weekly chart with a shared scale
- Tap any day for an hour-by-hour comparison
- Choose up to three models and keep your selection for next time
- Free members can try Compare mode; Premium use is unlimited
Explore Map: Out of Beta.
ImprovementThis past weekend I went to the Zirkel Wilderness and was trying to find a dispersed camp spot away from the campground where it'd be a little cooler. I was using the Explore map, scrolling around endlessly, and realized it could be much better.
- The Explore map is out of beta and easier to use for scouting real places before a trip
- Use the new search bar to enter latitude and longitude coordinates or fly straight to a specific trail, peak, ski area, saved location, or town
Search by Coordinates
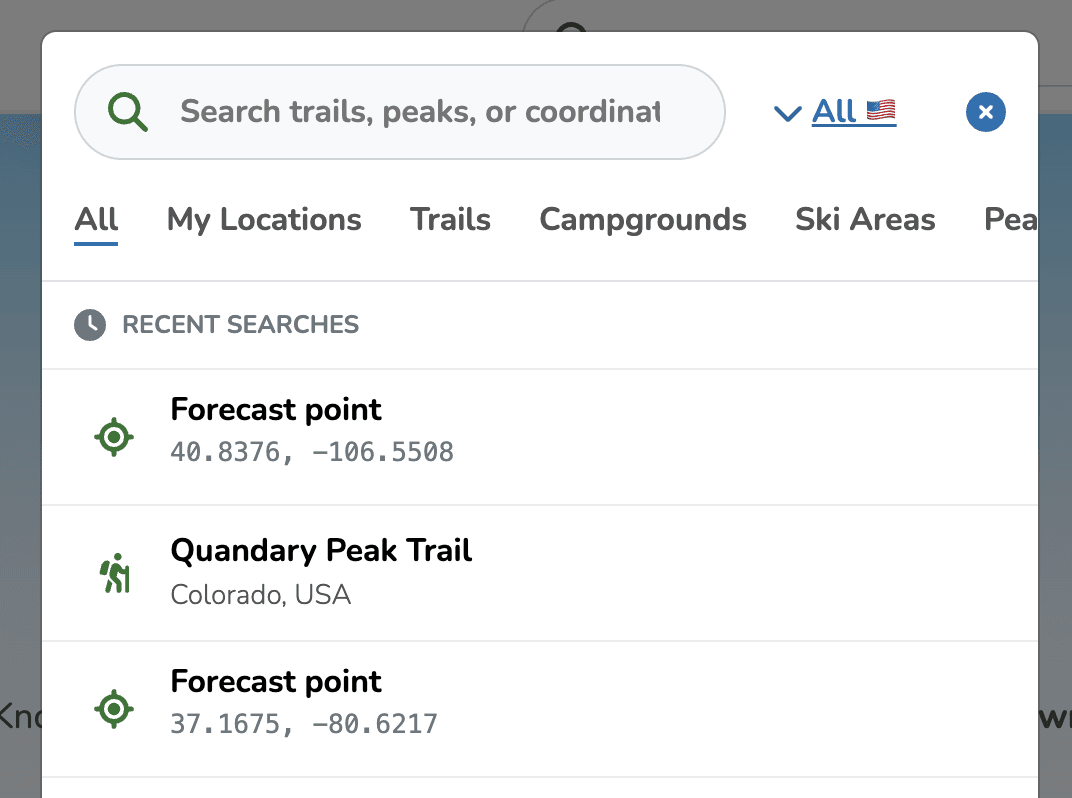
Minor UpdateA user emailed me on a trip: he scouts peaks and campsites in a separate mapping app and wanted to drop those exact spots into TrekWeather without hunting around the map by hand. So now you can paste them. Type or paste a latitude and longitude into the search box and you jump straight to the forecast for that exact point, at its real elevation. No account needed.
- Paste coordinates like 40.34, -105.68 right into the search box
- Lands on the full forecast for that exact point, at its elevation
The Two-Week Pass
Minor UpdateHeading out for one trip and want the full forecast toolkit without committing to a subscription? The Two-Week Pass unlocks all of Premium for 14 days for $1.99. It is a one-time purchase, so nothing auto-renews and there is nothing to cancel. When it ends you simply go back to the free plan, and you can grab another pass or switch to monthly or annual whenever you want.
- Full Premium access for 14 days: detailed hourly, snow totals, model switching, AI summaries, and the rest
- One-time $1.99, no auto-renew and nothing to cancel
Lightning Potential: A Smarter Storm Score
ImprovementThe engine behind Lightning Potential has been rebuilt. Instead of letting one number decide the signal, it now reads the ingredients that make thunderstorms possible: available energy, instability, the cap that holds storms down, and whether the model shows rain forming. A real storm needs those pieces to line up, so the new score weighs them together before calling a setup High or Extreme. That should mean fewer false alarms on hot, quiet afternoons, while still keeping loaded skies elevated when the model is not painting rain yet. The score is deterministic, inspectable, and now explains why each forecast landed where it did. Still in beta, and still planning guidance only: always check official forecasts, radar, alerts, and the sky in front of you.
- Storm ingredients are scored together, so one spiking value cannot drive the whole signal on its own
- Designed to avoid false calm: a loaded sky can stay elevated even when rain is not in the model yet
- Each tier now explains itself with plain-language reasons behind the call
- Missing model data shows as unavailable instead of a falsely reassuring Low
Lightning Potential
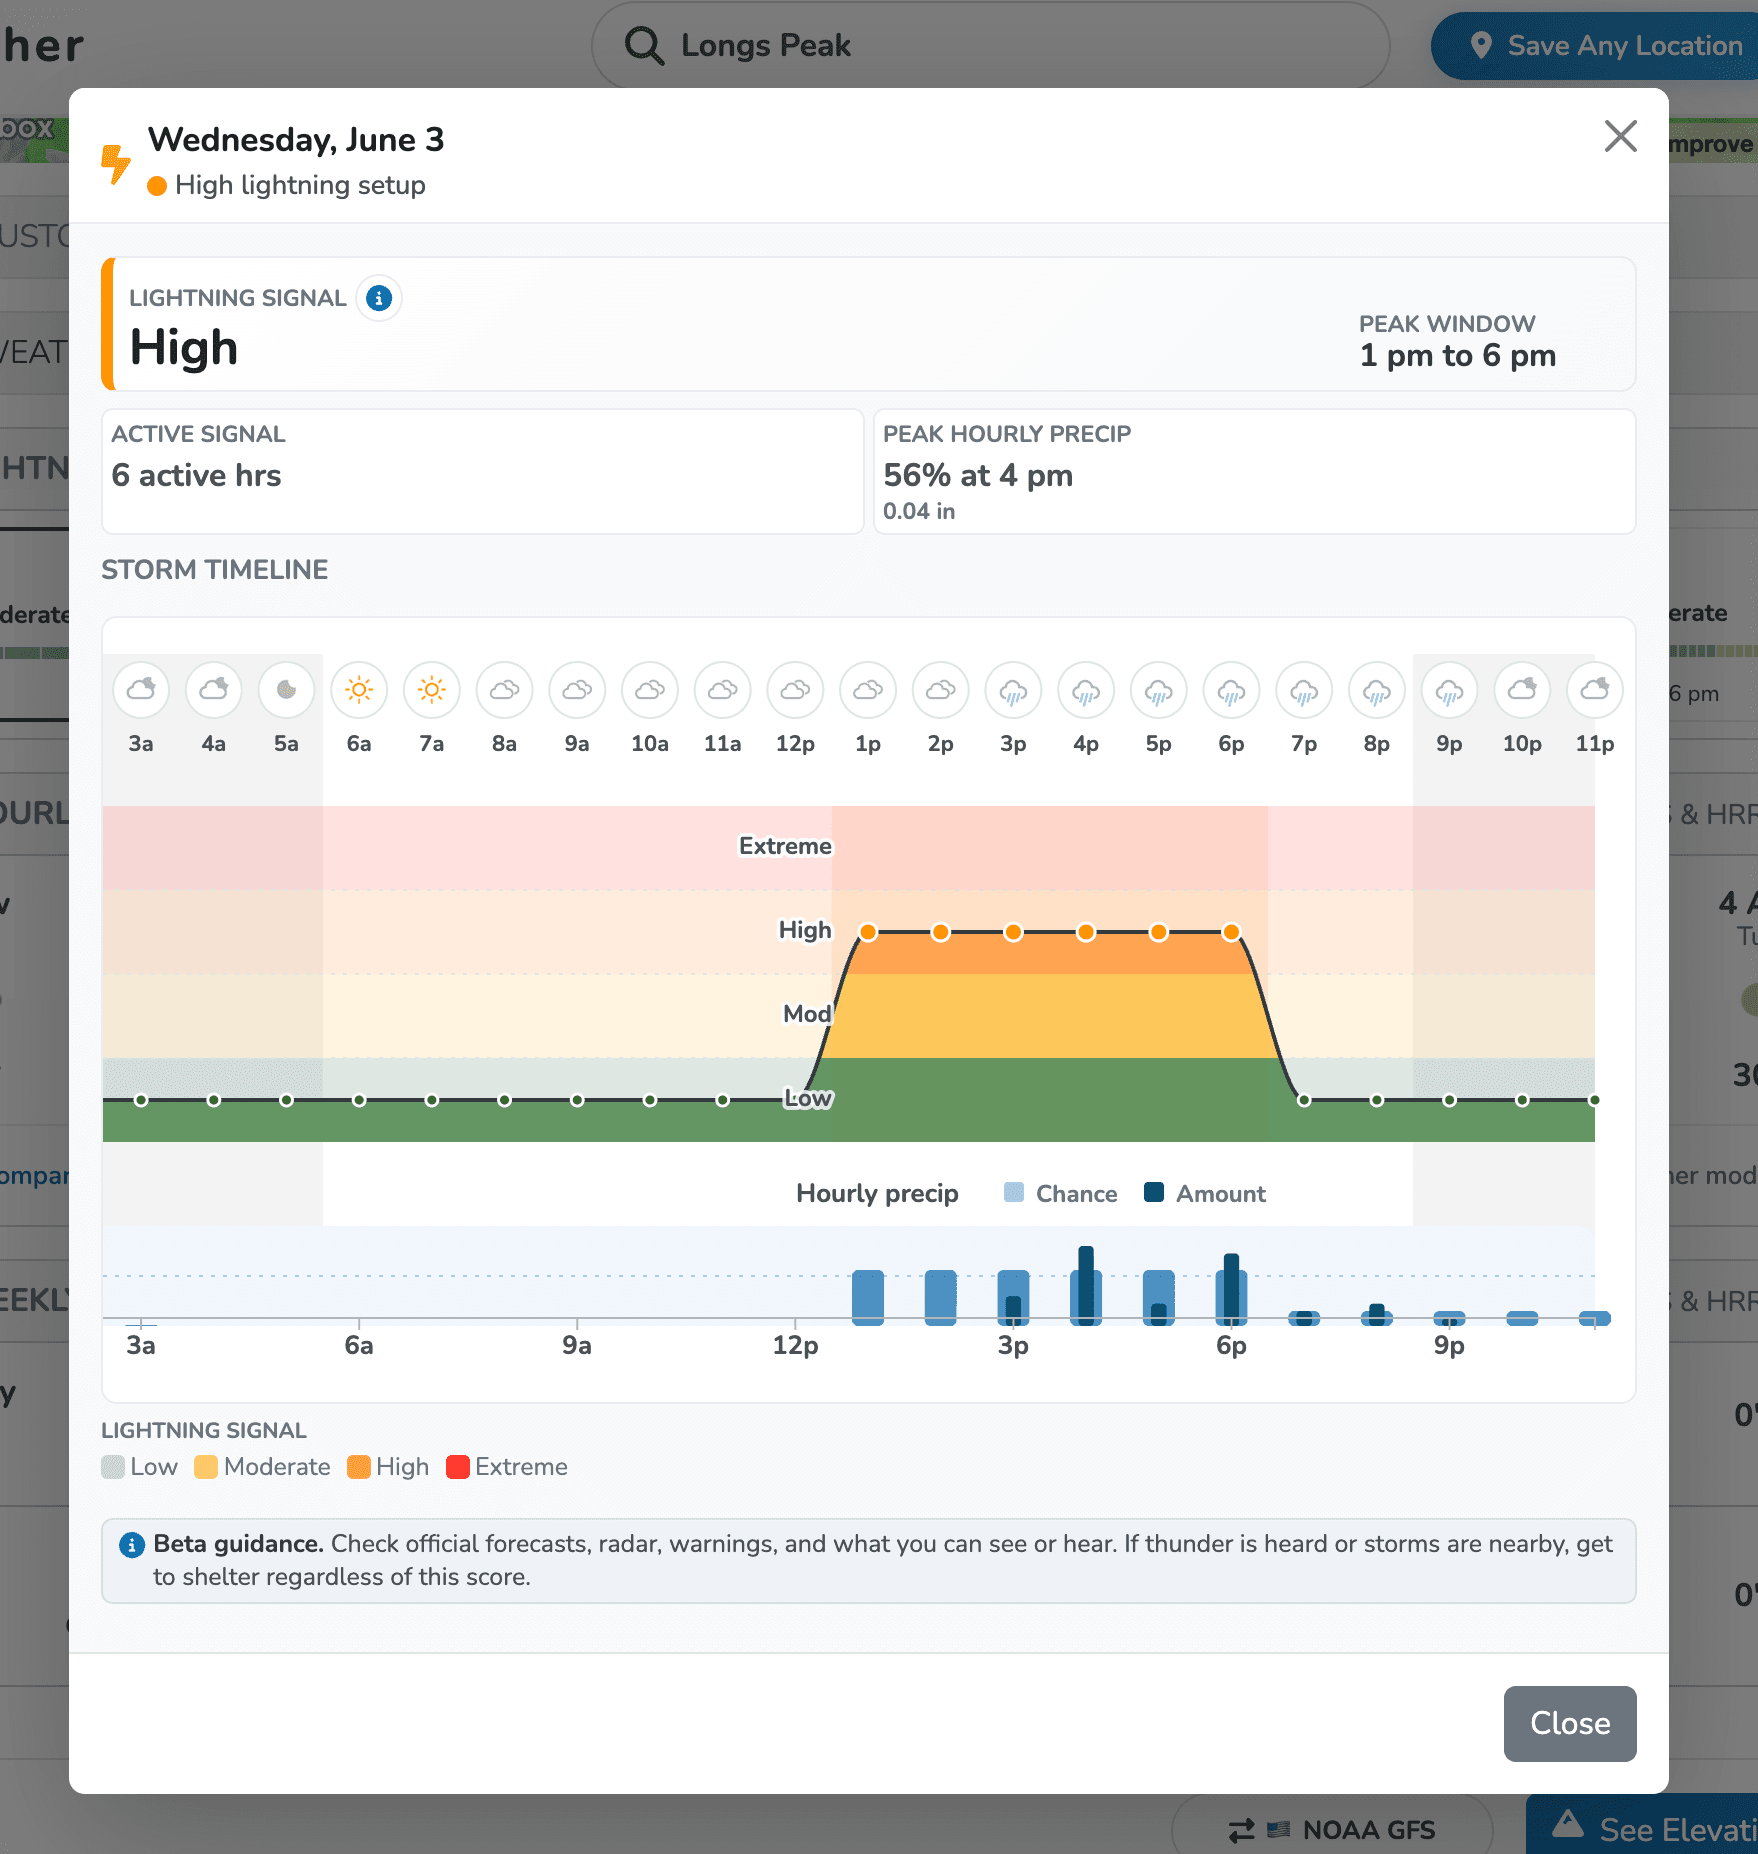
Major ReleaseLightning Potential is launching in beta to help you spot elevated thunderstorm setups before a trip. It shows the hours most likely to have lightning-supporting conditions at the spot you're checking, up to seven days out, so you can plan around the strongest signal. The score uses forecast convective ingredients like CAPE, Lifted Index, and CIN for supported locations in the United States. Today's lightning signal is always free; Premium unlocks the rest of the week.
- A seven-day strip showing each day's lightning signal at a glance
- Tap any day for the hour-by-hour storm window and peak timing
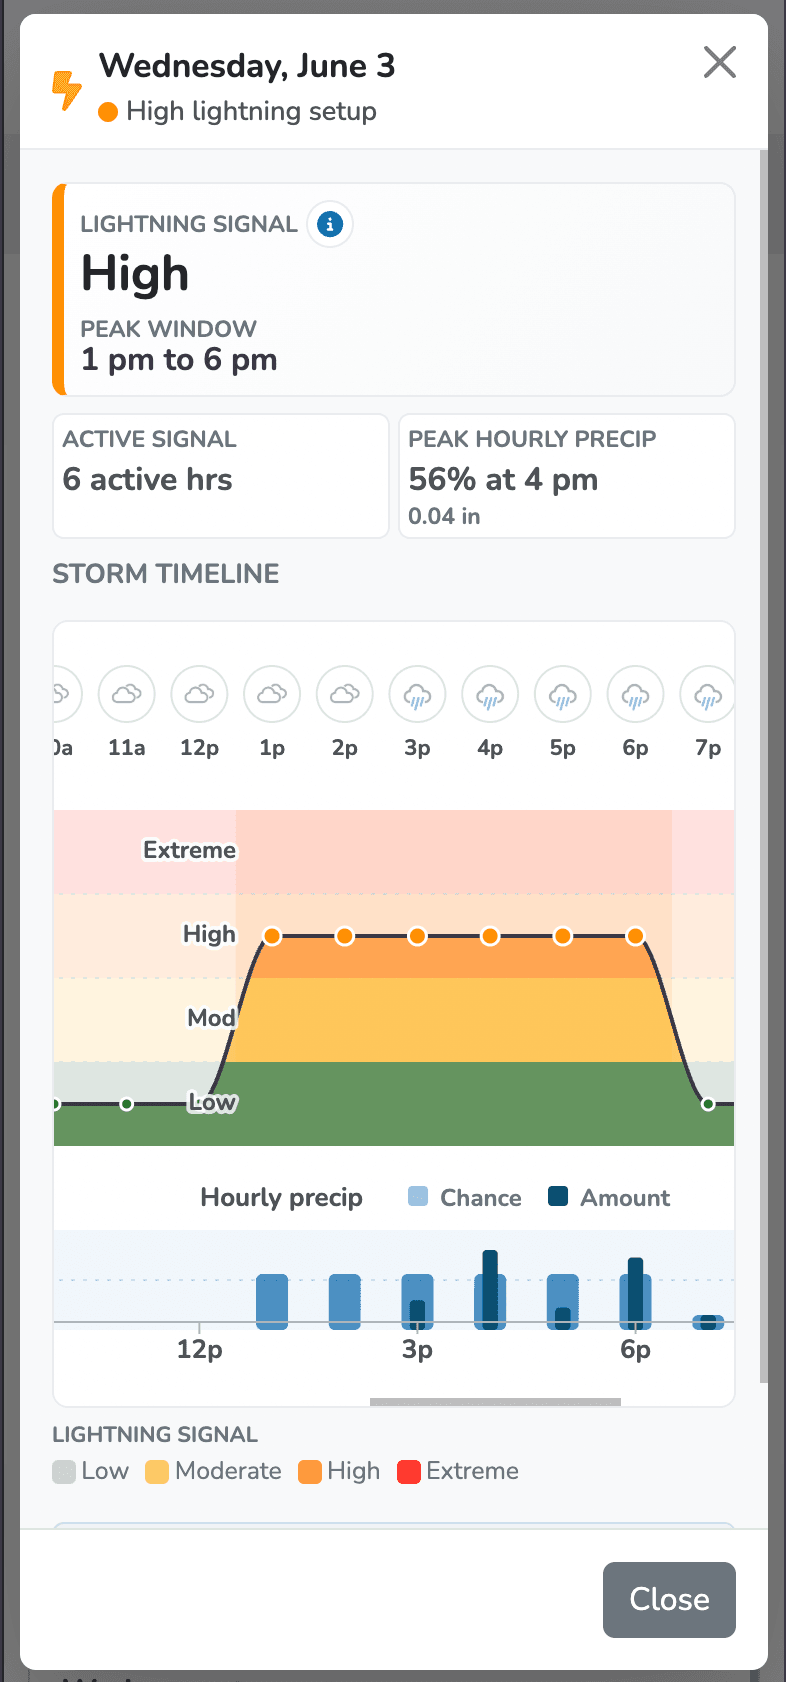
This one is in beta, I'm still tuning the signal. Always recheck conditions before you commit.
Additional Fields
Minor UpdateThe hourly forecast is now the deepest view in TrekWeather, and I made some quality of life improvements. I added a pressure trend line that shows whether the barometer is rising or falling and how it sits against standard pressure, folded the feels-like temperature right onto the temperature line, and merged humidity with dew point so the table reads cleaner. Freezing level is in there too, which matters a lot when you are getting high in the mountains. Also I made it easier to see if it is going to rain in the hour and how much. This is for people who need a very focused forecast. Happy Trails!
- Pressure trend line: rising, falling, or steady against the 29.92 in baseline
- Feels-like temperature folded onto the temperature line
- Wind, dew point, humidity, and freezing level, hour by hour
- Precip Percentage + Amount and shaded for intensity
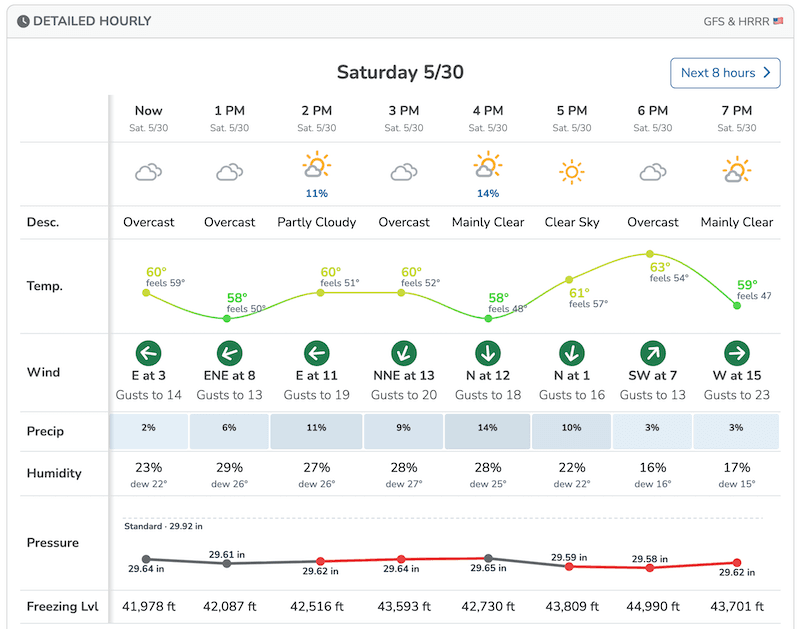
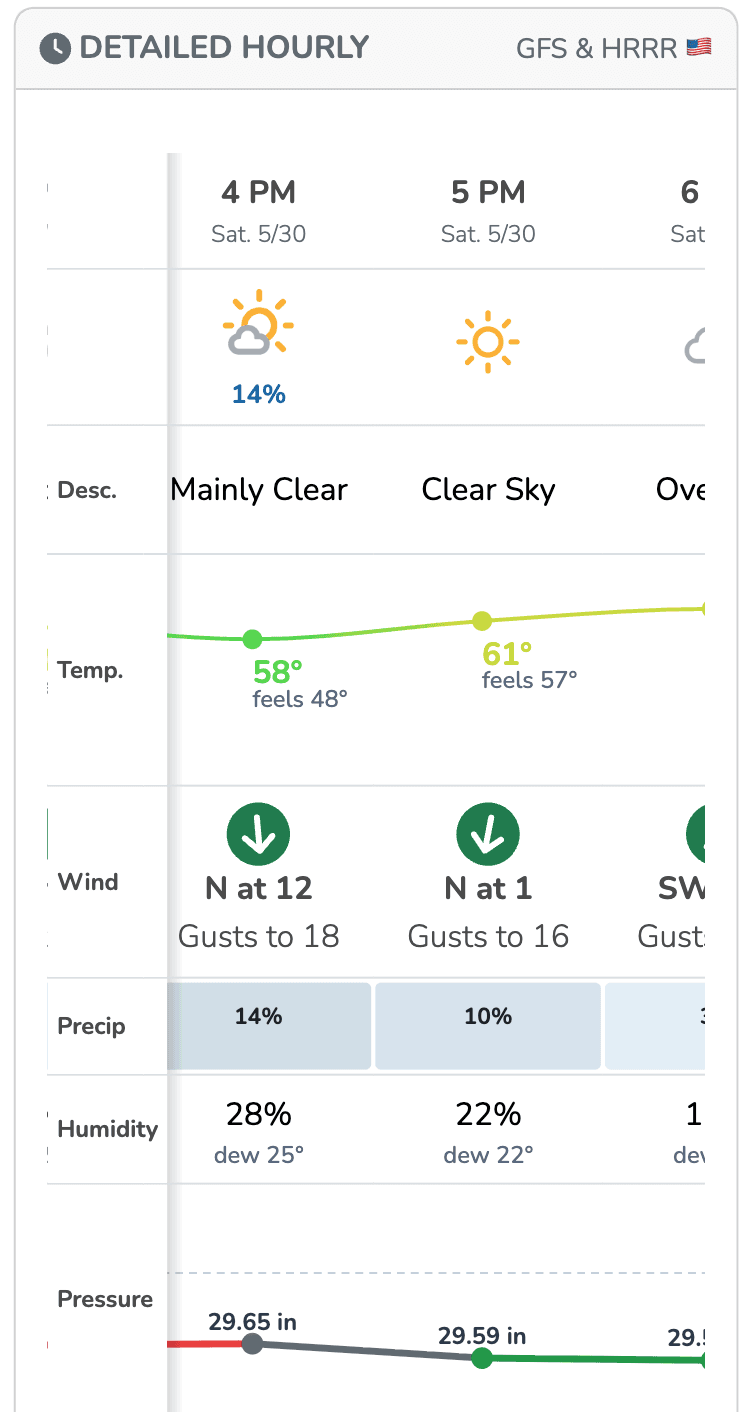
Not looking good for Wine + Cheese on the Deck
Field Notes: The TrekWeather Blog
Minor UpdateTrekWeather has always been the forecast tool. Now there is a place for the trips behind it. My wife Bricelyn and I will both be writing here, starting with her week in Utah across Arches, Zion, and Capitol Reef. Real photos, real trails, real weather. No AI ghostwriting, no content farm.
Read the blogCustomize Your Forecast
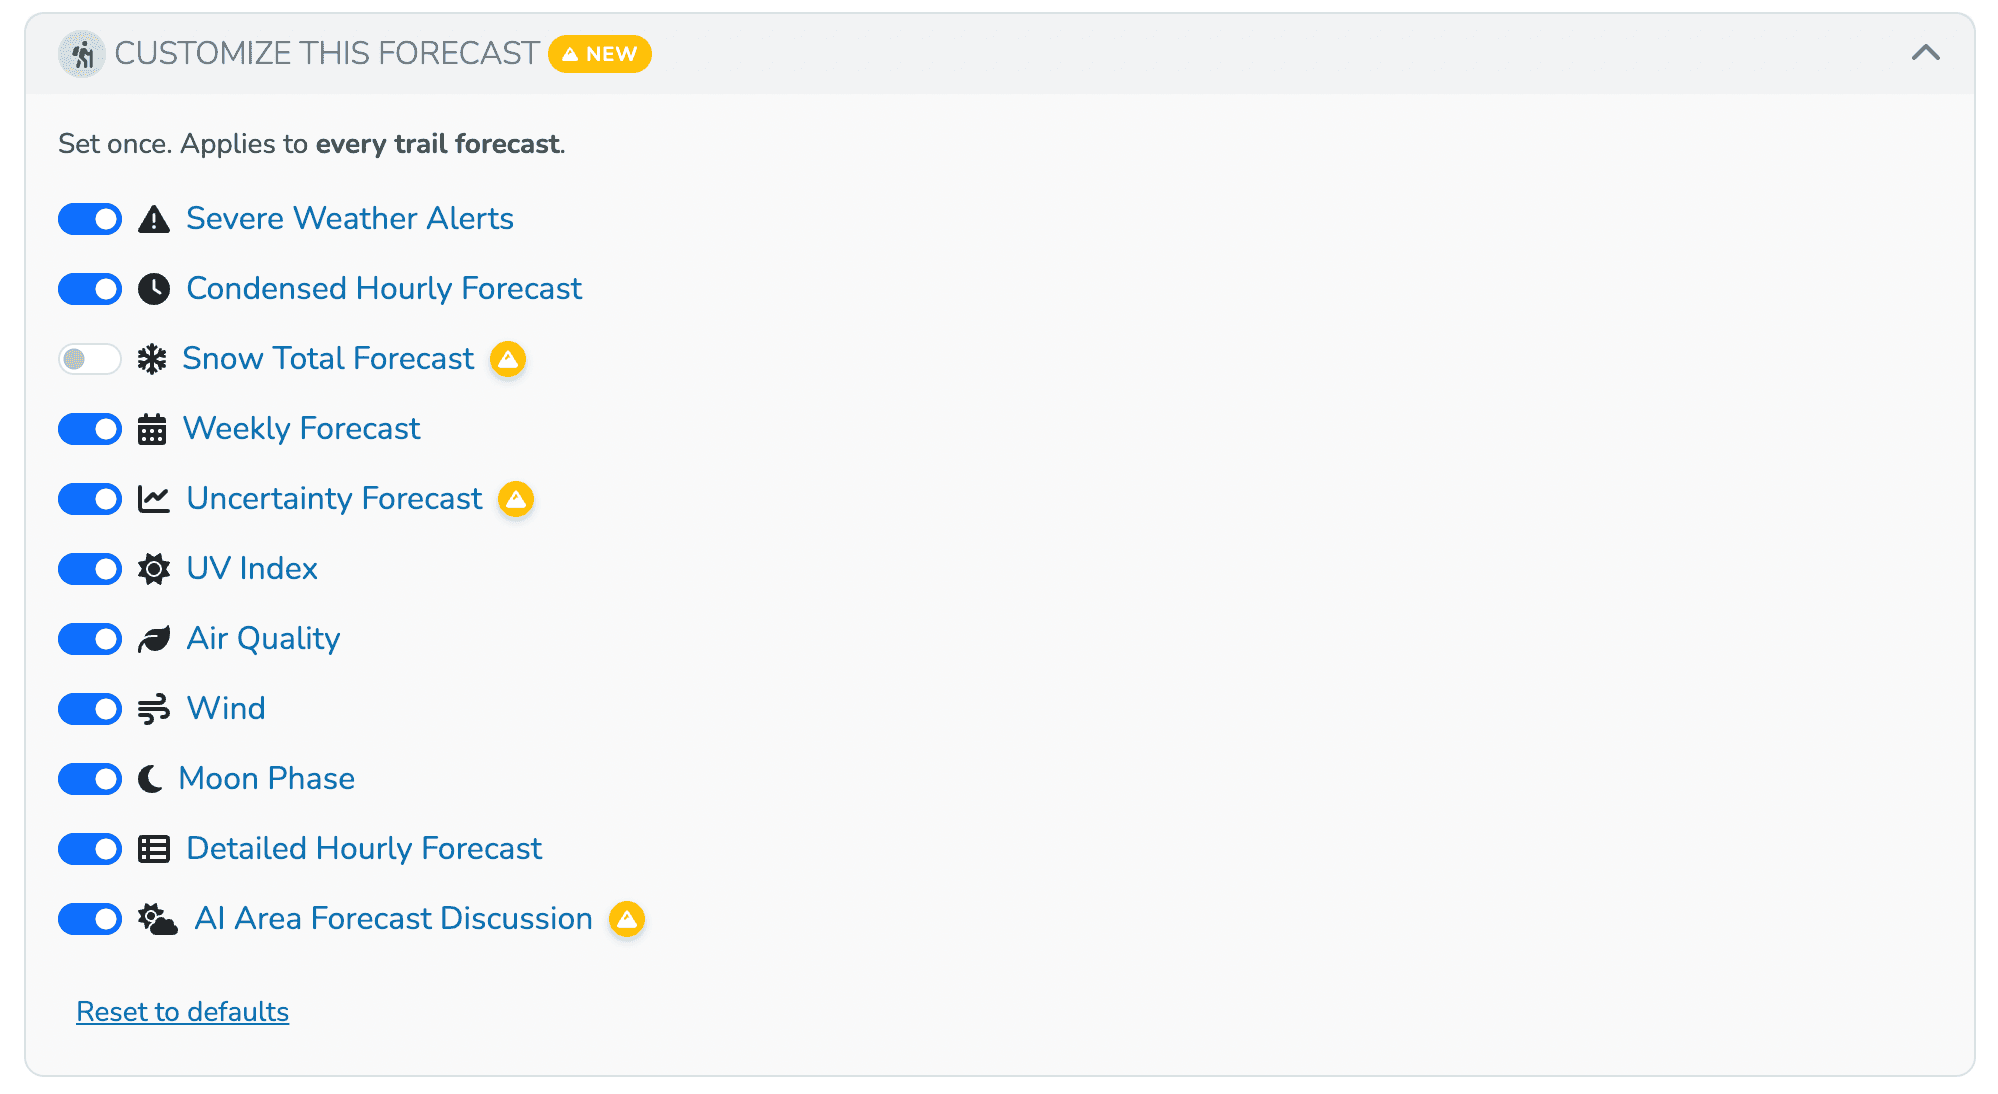
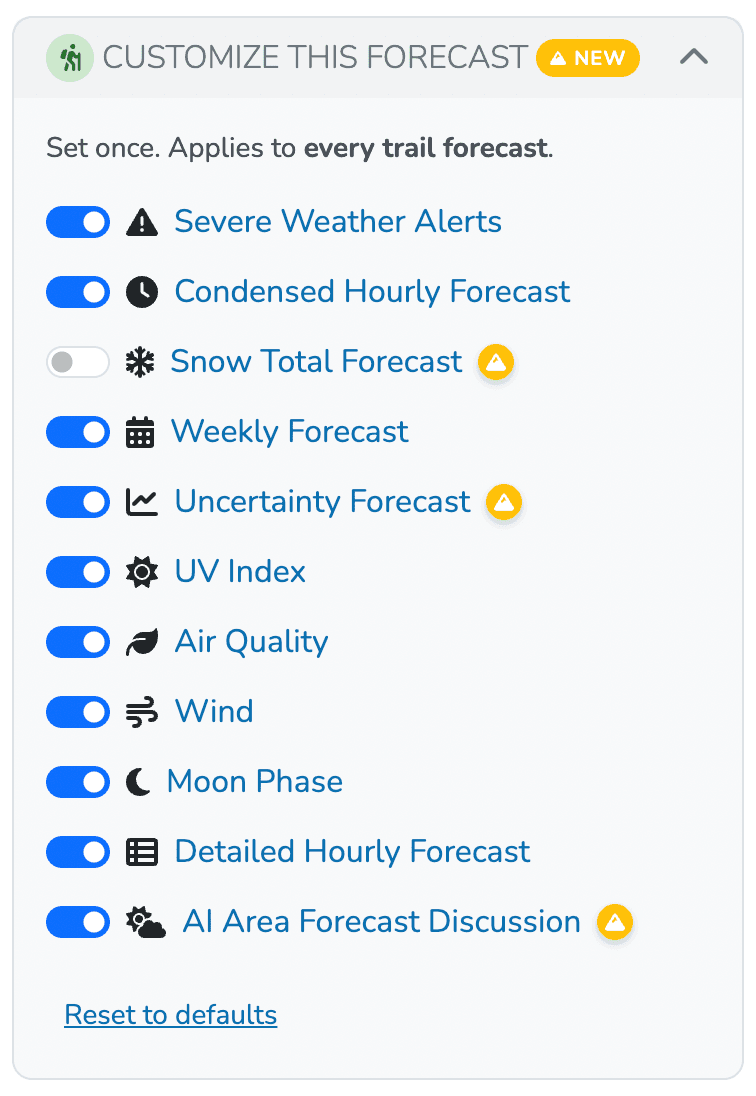
Major ReleaseForecast pages used to show the same cards to everyone. My friend Blake, who lives in Washington DC, always thought it was sort of hilarious that he saw snow totals for DC in July. To fix that, every forecast now starts with the cards that actually make sense for the location type, and you can flip any of them on or off from the Customize this forecast card at the top of the page.
Premium members get one more layer: every saved location keeps its own settings. Your house, your favorite cliff, or your favorite backcountry area can have completely different widgets.
- Every card is togglable, from Severe Weather Alerts to AI Area Forecast Discussion
- Smart defaults across all seven location categories
- Each saved location keeps its own preferences (your house vs. your favorite trail)
- No more snow totals in July in Washington D.C. ☠️
AI Summary v2
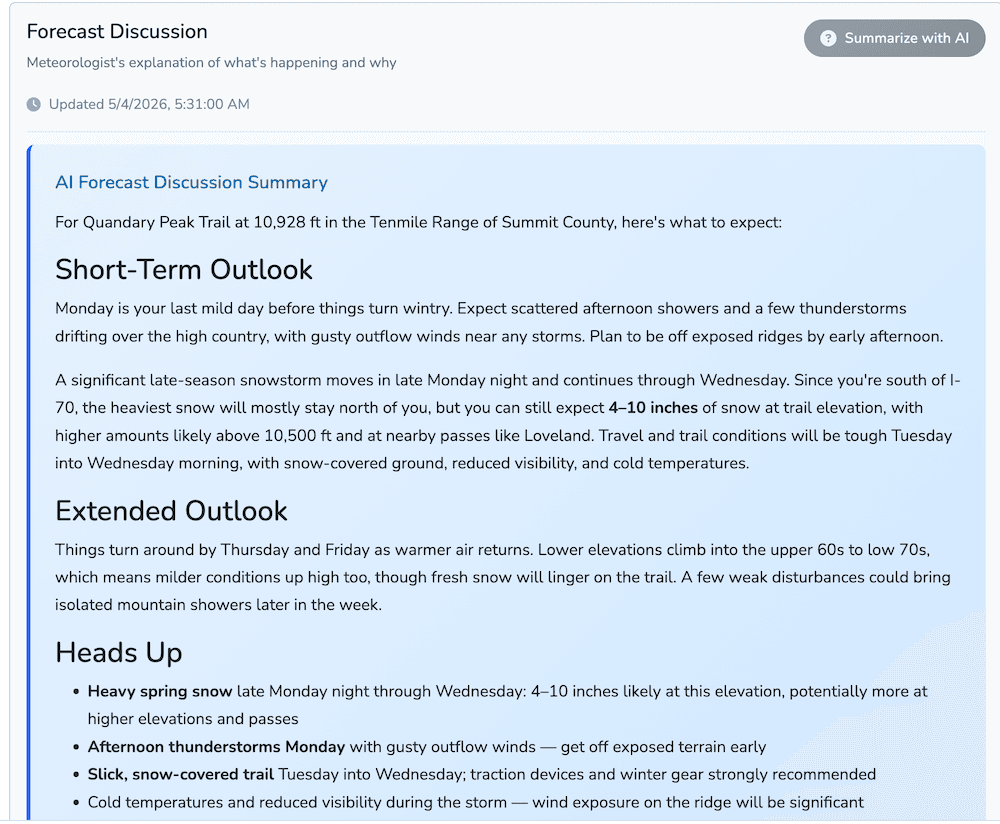
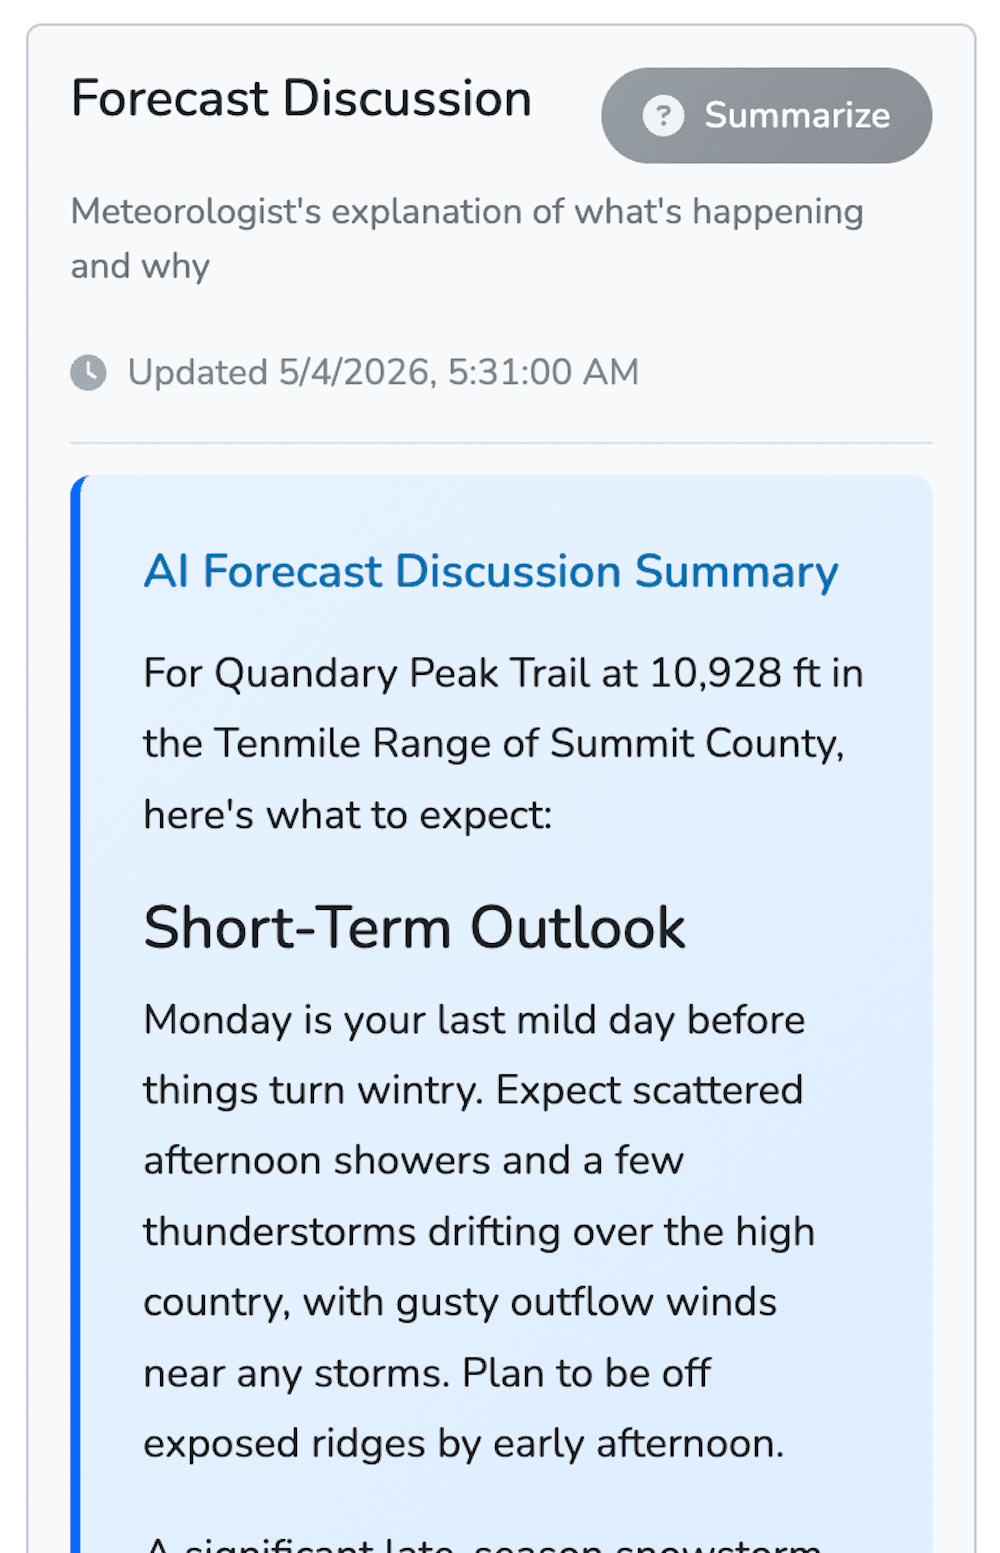
ImprovementI kept hitting AI summaries that talked about Denver weather while I was looking at a trail in the Mount Evans Wilderness at 13,000 ft. That's sort of useless. v2 fixes it. The summary now reads the forecast for the actual mountain, at your elevation, with awareness of trailhead vs. ridgeline. Not the nearest town's weather.
- The old AI summary told me about Denver. v2 talks about the actual trail.
- Elevation, exposure, and ridgeline awareness included by default.
Compare GFS vs GEM Side by Side
Minor UpdateIt's snowing a lot at my cabin (for late April of all times) and I wanted to see how much. I realized GFS and GEM can disagree wildly on the same place, so I built a feature where you can stack them side by side on the hourly view. Hit "Compare with GEM 🇨🇦" (or GFS 🇺🇸 if you're on the Canadian model) in the hourly strip and a second row appears below the primary, time-aligned, on a single horizontal scroll. All 72 hours of both models. Premium gets unlimited use, everyone else gets 3 free opens.
- Stack U.S. and Canadian hourly models side by side, time-aligned
- All 72 hours of both models in one view
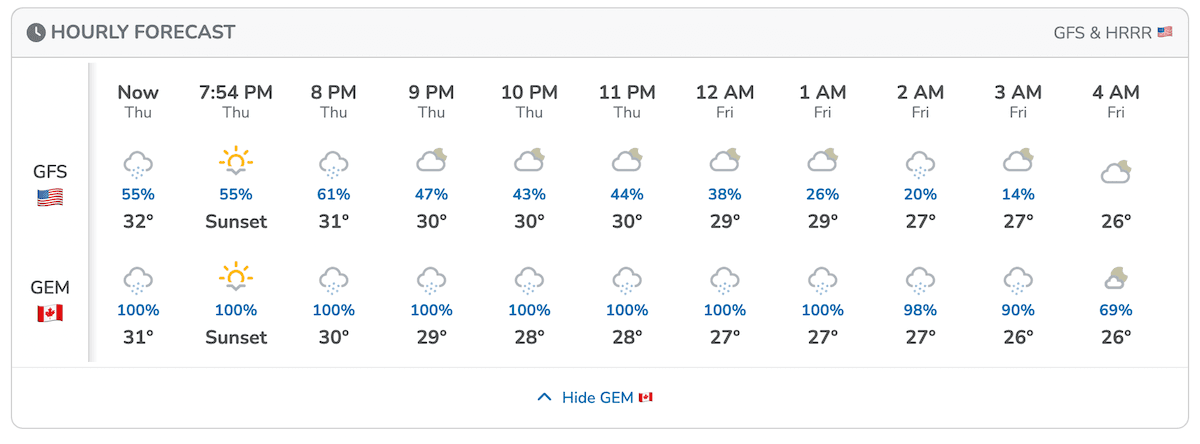
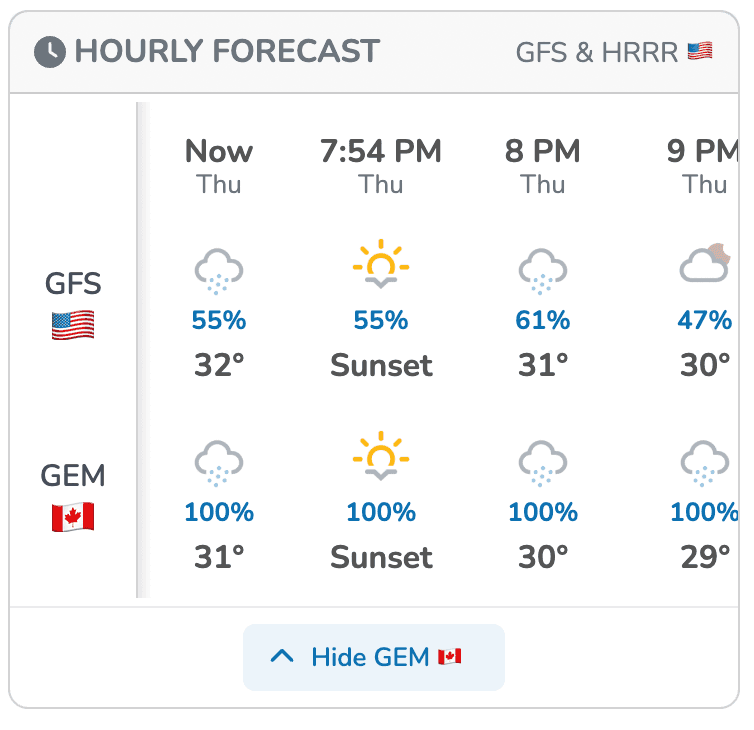
GFS shows 14-61% precip tonight, GEM shows 69-100% for the same hours. Exactly the kind of disagreement this view surfaces.
72 Hours in Hourly Forecast
Minor UpdateI spent a week driving my camper (named Bilbo) around Utah's national parks. The weather was quite variable, which was the best time to use my own app and notice what was missing. First thing I changed: I made it show 3 days of hourly weather instead of 2. I also added precipitation probabilities for each hour. More small tweaks and updates coming soon!
- 72 hours (3 days) of hourly weather on every forecast for signed-in users
- Precip chance shows under the weather icon when it is over 10%, on both the detailed table and the condensed strip
River Flow: Real-Time USGS Gauge Data (Phase 1)
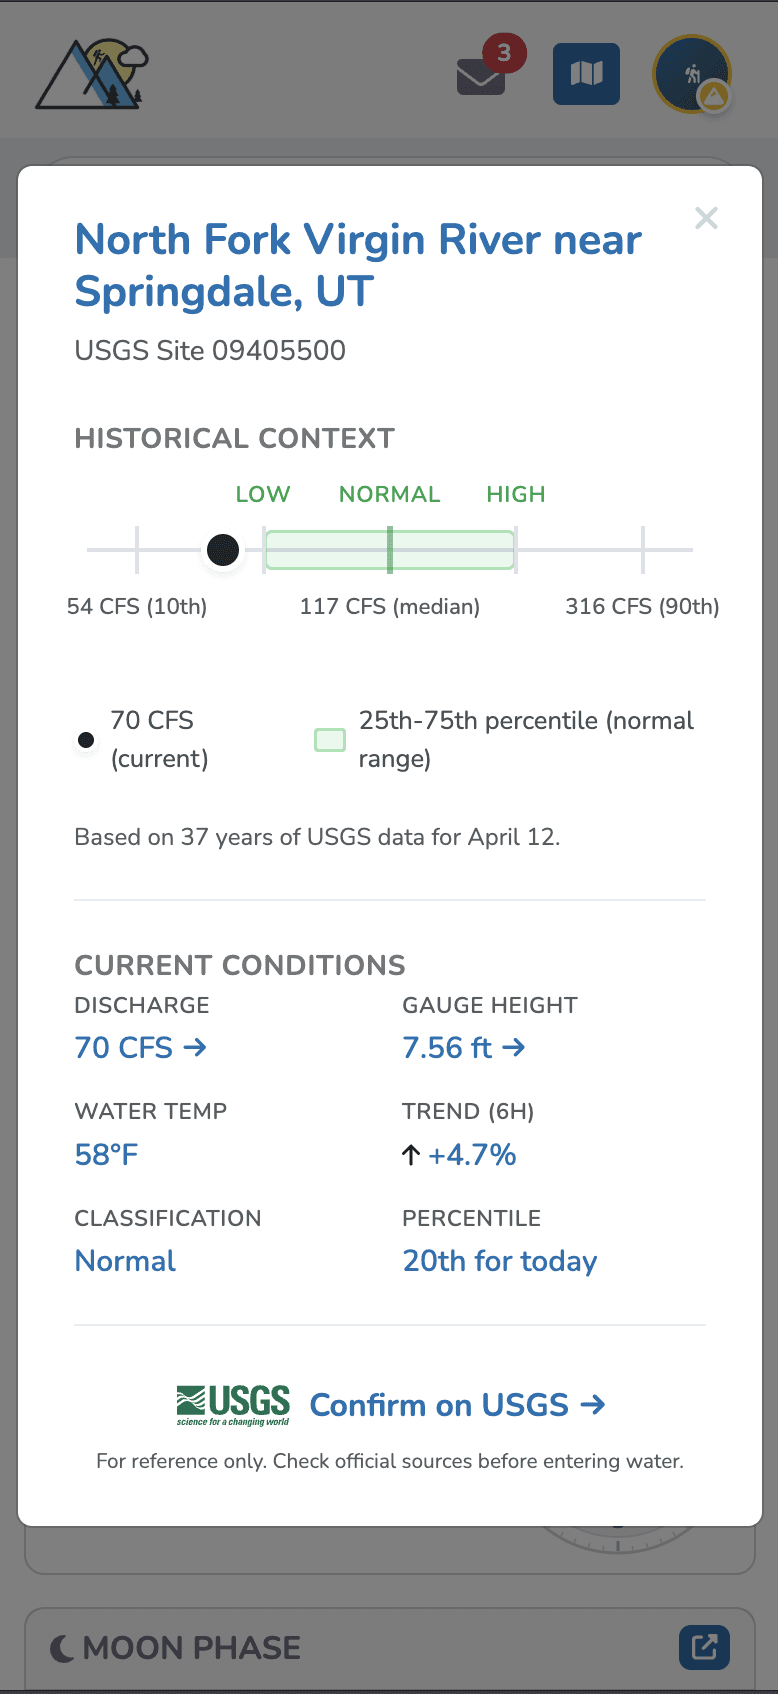
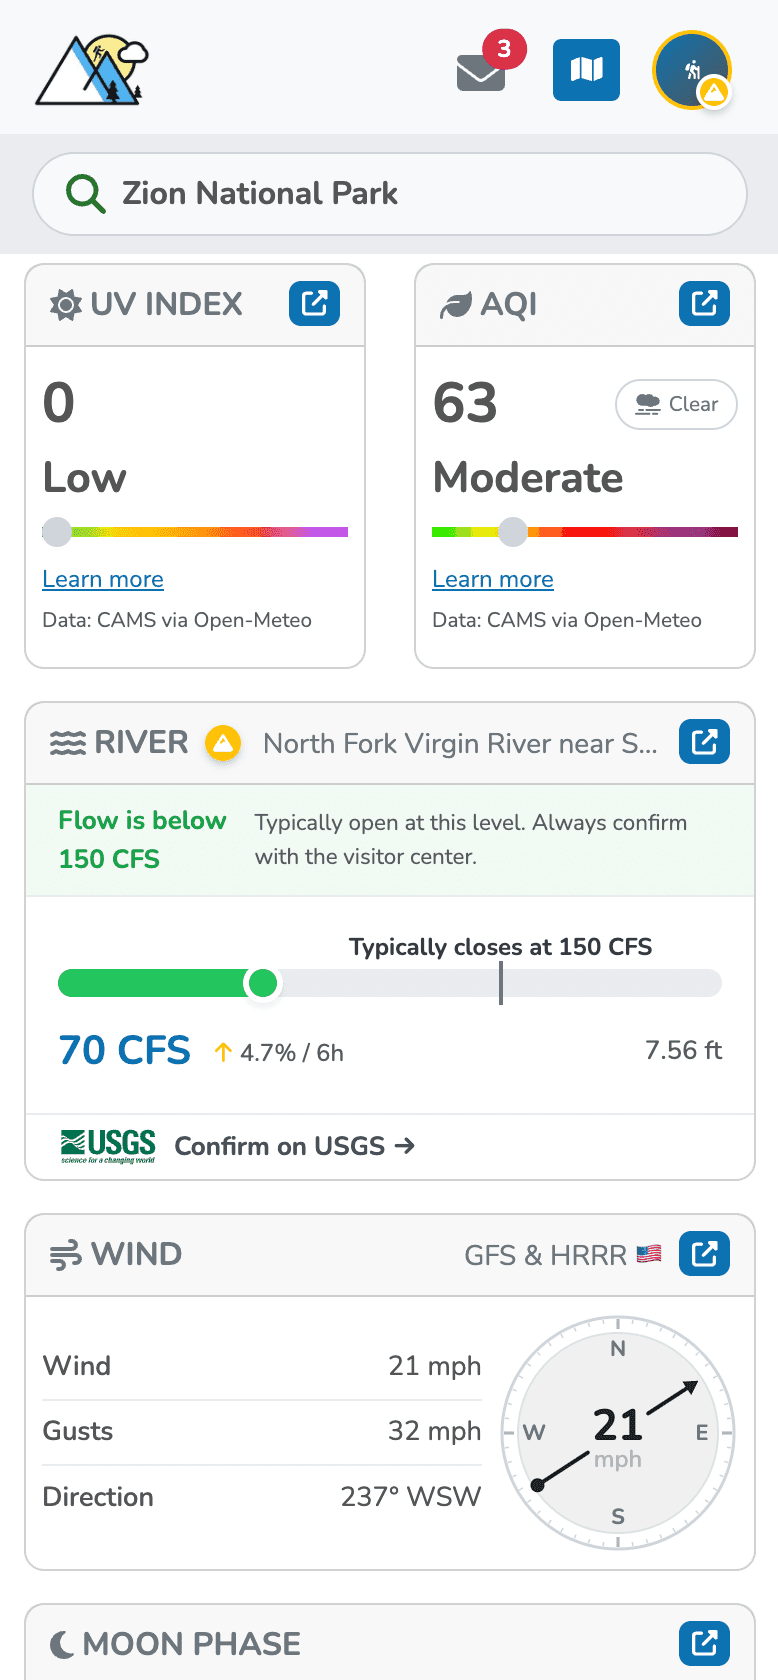
Major ReleasePlanning a hike through The Narrows at Zion? Now you can check real-time river conditions before you go. TrekWeather pulls live data from over 6,500 USGS stream gauges across the country and compares current flow to 30+ years of historical data for that specific day of the year. For trails like The Narrows and The Subway, you'll see whether flow is approaching the level where the NPS typically closes access. This is Phase 1, with historical charts, more trail linkages, and rafting features on the way.
- Real-time discharge (CFS) and gauge height from USGS, updated every 15 minutes
- Seasonal flow classification: compares today's reading against 30+ years of historical data for this exact date
- Closure advisories for trails like The Narrows (flow vs. the NPS closure threshold)
- Detail modal with percentile box plot showing where current flow sits in the historical range
- Discharge and gauge height link directly to the specific USGS data graphs
- 6,500+ USGS gauges browsable on the Explore map
- Linked to 15 high-value trails, parks, and campgrounds (Zion, Paria Canyon, Havasu Falls, Yellowstone)
Moon Phase Tracker
Minor UpdateI can never sleep during a full moon when I'm backpacking, so knowing the phase before a trip is a must (or at least I know to bring my eye mask). I also skin up Loveland Ski Area after they close, and we love to go on full moon nights. Now you can see the current moon phase, illumination, and moonrise time right on the forecast page, and tap it to open a detail view with a monthly calendar.
- Moon phase, illumination, and moonrise on every forecast
- Detail modal with night sky visual and day-by-day scrubber
- Monthly calendar showing the phase for every day
- Key dates for upcoming full and new moons
New FAQ Page + Spring Theme 🌿
Minor UpdateAdded a Frequently Asked Questions page based on real user feedback. Covers pricing, saving locations, weather models, and more. Also freshened up the site with a spring theme.
- Answers to the most common questions from real users
- Links throughout to help you find features faster
- Interactive "My Locations" link opens your saved spots right from the FAQ
- Spring theme: new mountainscape, Colorado sky gradient, and seasonal icons 🌱
Search is Hard — Improved Search
ImprovementA user types "Loveland". Did they mean the pass, the town, or the ski resort? Another example: if you search "Zion", do you mean the national park? The campground, which is called Watchman? Or some of the trails, like Angels Landing? Turns out, search is a really challenging problem to solve, and I made a lot of improvements to try to make it better for our end users.
- Smarter result ranking that better matches what you actually want
- Improved handling of searches that could mean multiple things
- Less scrolling, more finding
Browse Uncertainty Forecasts Day by Day
ImprovementPlanning a multi-day trip and want to compare how confident the forecast is for each day? Now you can tap any day below the uncertainty chart to see the hourly breakdown, then swipe between days without leaving the view. No more closing and reopening to check the next day.
- Tap a day pill to jump straight to that hourly forecast
- Navigate forward and back between days inside the detail view
- Your selected variable and model stay put as you browse
My Locations: Favorites & Saved in One Place
ImprovementWhen you search, the new "My Locations" tab shows both your favorites and saved locations together. Each section has its own header, and items that are both favorited and saved show both badges so you can tell at a glance.
- Favorites and saved locations combined in one search tab
- Section headers to keep everything organized
- Heart and saved badges for quick visual identification
- Filter both lists by name or state as you type
Save Any Spot on the Map
Minor UpdateTap anywhere on a trail, peak, or campground map to see the weather at that exact spot, then save it. Your saved locations now show up as pins right on the map, so you can tap one to jump back to it anytime. Perfect for marking a campsite, a summit approach, or that sheltered lunch spot at 10,000 feet.
- Tap the map to preview weather, elevation, and coordinates, then save the spot
- Your saved locations appear as pins on every map
- Tap any pin to view details or navigate to its forecast
- Cleaner location pages with improved map styling
Wind Dashboard, Pull-to-Refresh & Polish
ImprovementWind gets its own dedicated card with a compass rose that shows direction and speed at a glance. Tap it to open hourly wind charts with gusts and direction over time. On mobile, pull down anywhere on the forecast to refresh, complete with a custom compass animation. Plus, the favorite button got a cleaner redesign, upgrade modals now show location-specific copy, and you can share TrekWeather with friends right from the app.
- Dedicated Wind card with animated compass rose visualization
- Hourly wind charts showing speed, gusts, and direction
- Pull-to-refresh on mobile with compass animation
- Redesigned favorite button with cleaner save experience
- Share TrekWeather via X, Facebook, Reddit, or copy link
- Polished upgrade modals with per-location-type copy
Trails Now Live in All 50 States
Major ReleasePhew! TrekWeather just went from 12 states to all 50. Nearly 20,000 new trails are now live with elevation-accurate forecasts. Whether you're hiking in Florida, backpacking in Montana, or exploring trails in New York, TrekWeather has you covered.
- All 50 U.S. states now have trail coverage
- Nearly 20,000 new trails added in a single update
- Every trail includes elevation, NOAA office, and timezone data
- Searchable and browsable on the Explore map immediately
Hourly UV, Air Quality & Wildfire Smoke
Major ReleaseTap the UV Index or Air Quality card to see hourly charts with current value, daily peak, and risk level. You can browse day by day and switch between metrics in one view. Plus, a new Wildfire Smoke metric tracks air particulate levels with EPA-based health categories.
- Hourly UV Index and Air Quality charts
- New Wildfire Smoke metric with EPA risk categories
- Switch between UV, Air Quality, and Smoke from one view
- Current value, daily peak, and risk level at a glance
- Day-by-day navigation for multi-day trip planning
Jump to Any State on the Map
ImprovementPlanning a trip far from home? No more tedious panning across the country. Use the new Jump to State button on the Explore map to instantly fly to any U.S. state. Just tap the paper plane icon and select your destination.
- Instant navigation to any of the 50 U.S. states
- Zoom levels automatically adjusted based on state size
- Smooth animated transitions to your destination
Wind at a Glance + Realistic Sky Transitions
Major ReleaseYou asked, we listened! Wind conditions are now front and center. See wind speeds and gusts directly in your hourly forecast with clear visual indicators. Plus, the weather animation now transitions naturally through golden hour, sunset, and twilight so the sky you see matches the actual time of day at your destination.
- Wind speeds shown in hourly forecast with visual indicators
- Animated wind effects when conditions are gusty
- Realistic golden hour and sunset sky transitions
- Weather-aware colors: overcast skies look appropriately muted
Ski Resort Weather by Elevation
Major ReleaseSee how weather changes as you go up the mountain. For ski areas, you can now view forecasts for three elevation zones: base, mid, and top. Click any zone to see the detailed forecast for that elevation. Perfect for deciding which part of the mountain to ski or whether conditions are better higher up.
- Three elevation zones: Base, Mid, and Top
- Click any zone to see its detailed forecast
- Compare conditions across different elevations
- See temperature, wind, snow, and more for each zone
Understanding Uncertainty Forecasts
Major ReleaseTraditional forecasts give you one number, but weather is inherently uncertain. Now you can see the full range of possible outcomes with our new uncertainty forecasts. Know when conditions are locked in vs. still uncertain.
- Snowfall and precipitation ranges
- Temperature confidence bands
- Wind speed variability
- Multiple model sources (ECMWF, GFS, GEM)
Try Point Forecasts Before Signing Up
ImprovementYou can now tap anywhere on the trail map to see a weather preview, no account required. A pulsing marker shows you exactly where to tap. After your first free preview, create a free account to unlock unlimited point forecasts and see detailed conditions at any elevation along your route.
Launched the Changelog
ImprovementAdded this changelog page so you can follow along with what's new in TrekWeather.
Smarter AI Forecast Summaries
ImprovementRewrote how the AI summarizes NOAA forecasts. Now you get a "Heads Up" section that calls out hazards like high winds, fire danger, and travel impacts. Summaries include actual numbers (snow totals, wind gusts, rain amounts) when NOAA provides them. No more weather jargon, just plain language written like a friend explaining the forecast.
Launched TrekWeather Premium
Major ReleaseAfter 7 years in the making, Premium is here! Snow totals, weather model switching, uncertainty forecasts, AI summaries, and expanded save limits.
- Snow Totals Forecast
- Daily Precipitation Totals
- Weather Model Switching (GFS, HRRR, GEM)
- Uncertainty Forecasts
- 50 Favorites & 500 Saved Locations
- AI Forecast Summaries